Our accuracy screen enables you to quickly evaluate the performance of your model through Excess Return and Hit Rate metrics. These metrics enable you to evaluate the success of a model's predictions versus the benchmark.
Note: if your portfolio has been created a while ago, a message may prompt you to recalculate it by clicking on the gear wheel next to portfolio name and selecting "recalculate" to enable the data for this feature.
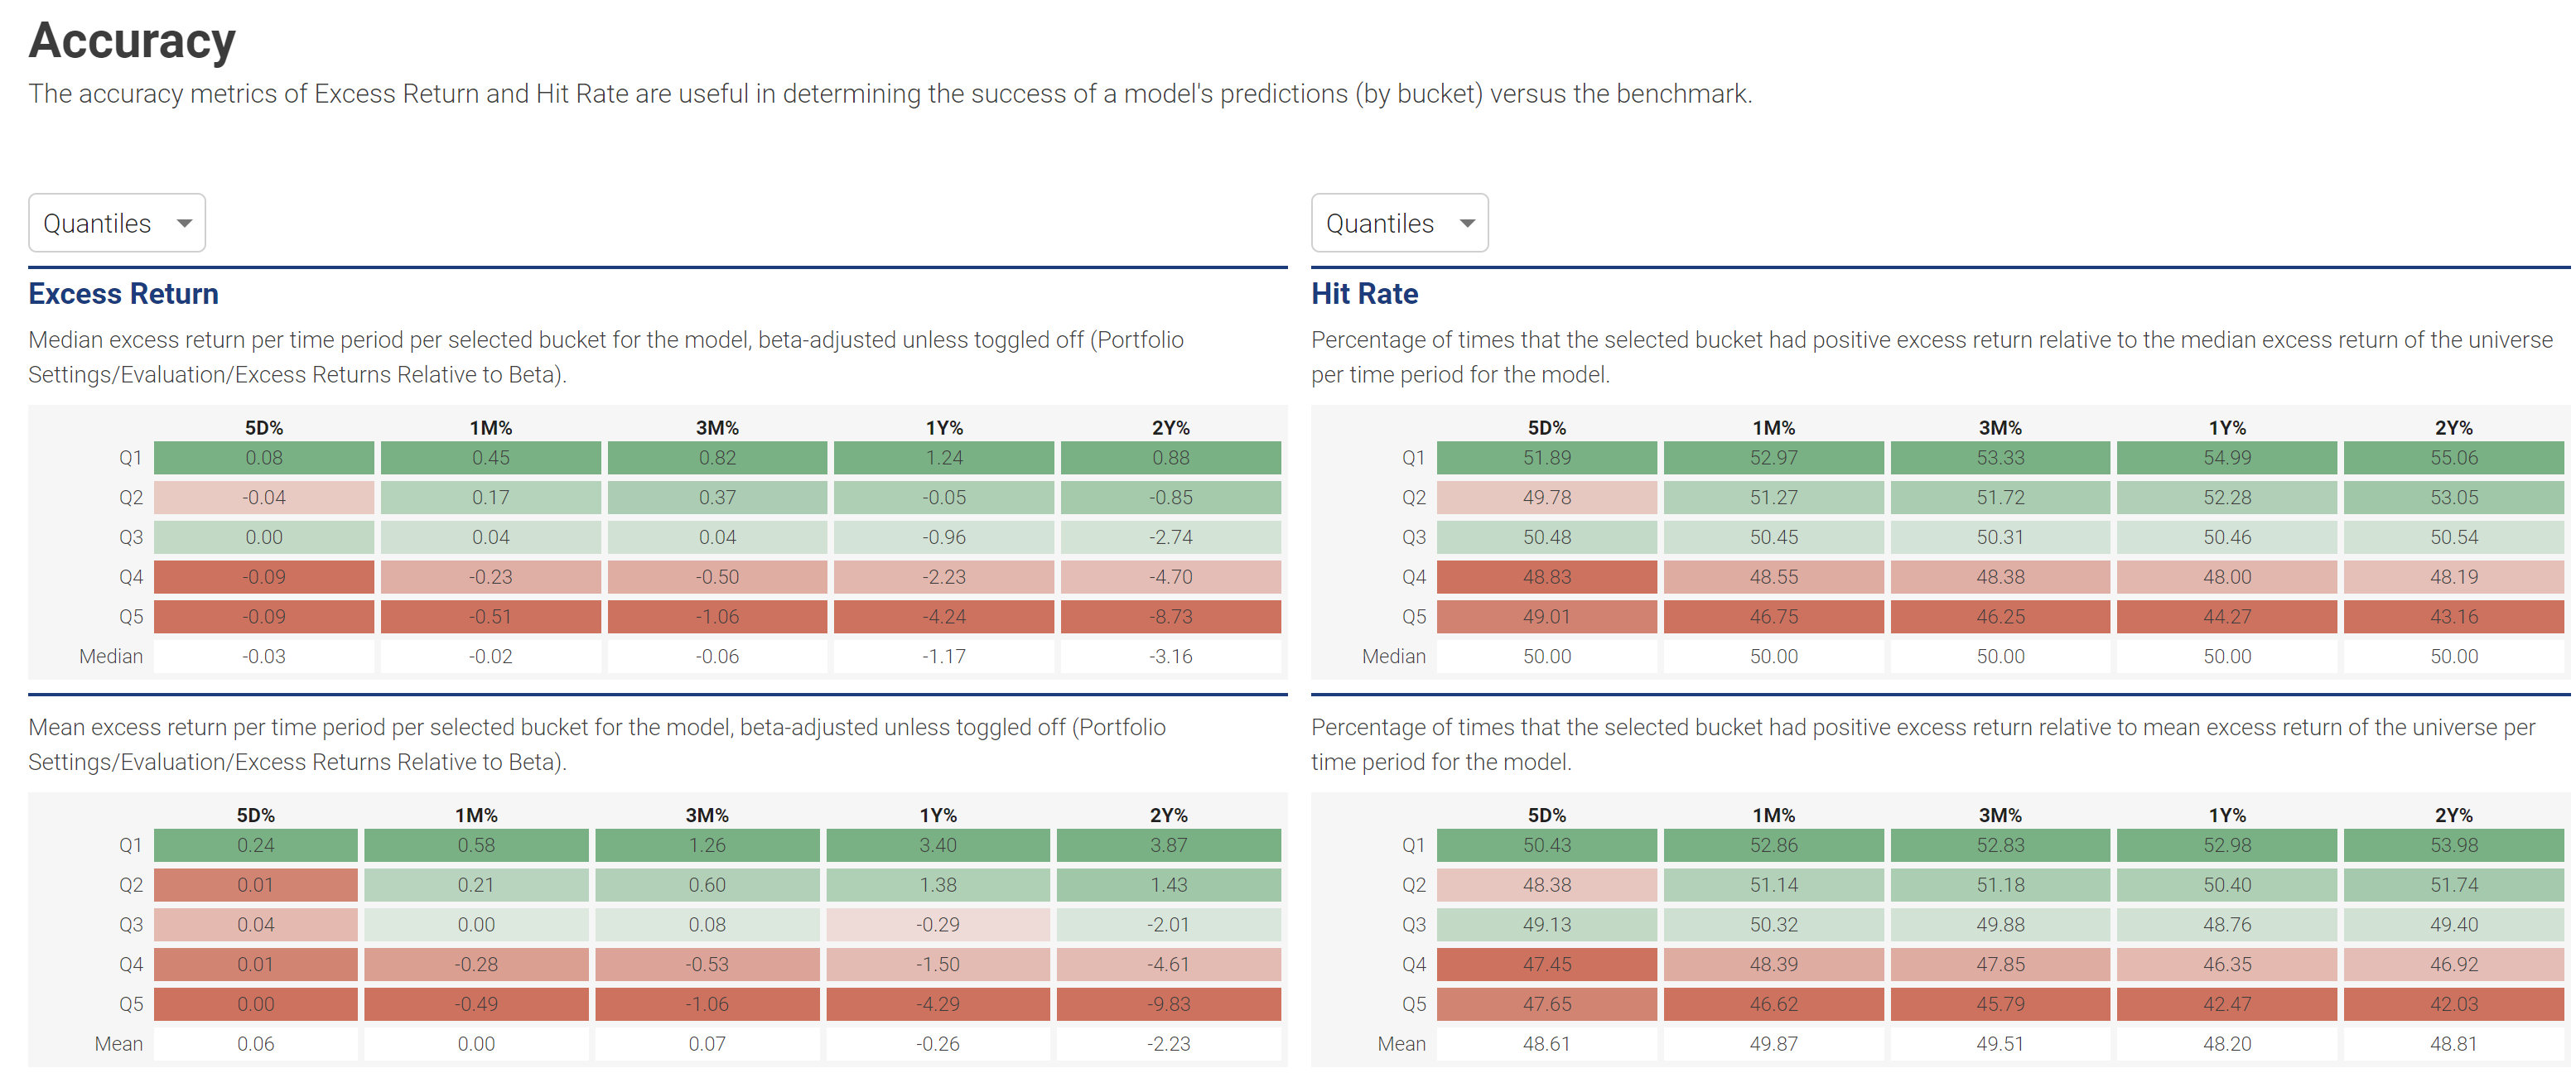
Securities Buckets are either Quantiles (Q1 to Q5 - similar to stocks rated from 1 to 5 Stars), Deciles (D1-D10) and Ventiles (V1-V20). Both Excess Return and Hit Rate buckets can be set independently and users can select from each level of granularity to assess performance at different levels.
Excess Return tables as shown on the left side showcase median (top) and mean (bottom) excess return per time period per selected bucket for the model, beta-adjusted unless toggled off (Portfolio Settings/Evaluation/Excess Returns Relative to Beta).
Hit Rate tables as shown on the right side showcase the percentage of times that the selected bucket had positive excess return relative to the median (top) and mean (bottom) excess return of the universe per time period for the model.