The allocation page highlights the allocation of your portfolio, and now you can also plot allocations, exposures and their cumulative performance on the chart.
Allocations
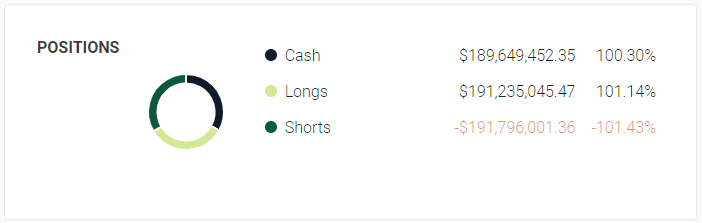
The top circle graph showcases your positions and how much of your portfolio is long, short or sitting in cash.
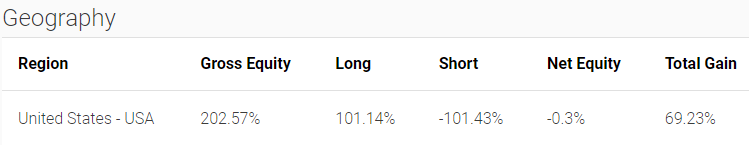
The second panel showcases geographical allocation of your portfolio.
The third panel circle graph showcases the various sectors your portfolio is allocated to in $ and net allocation.
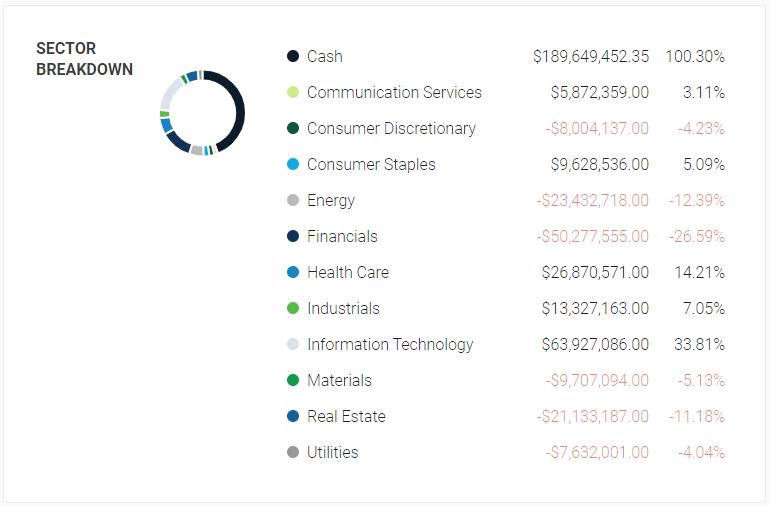
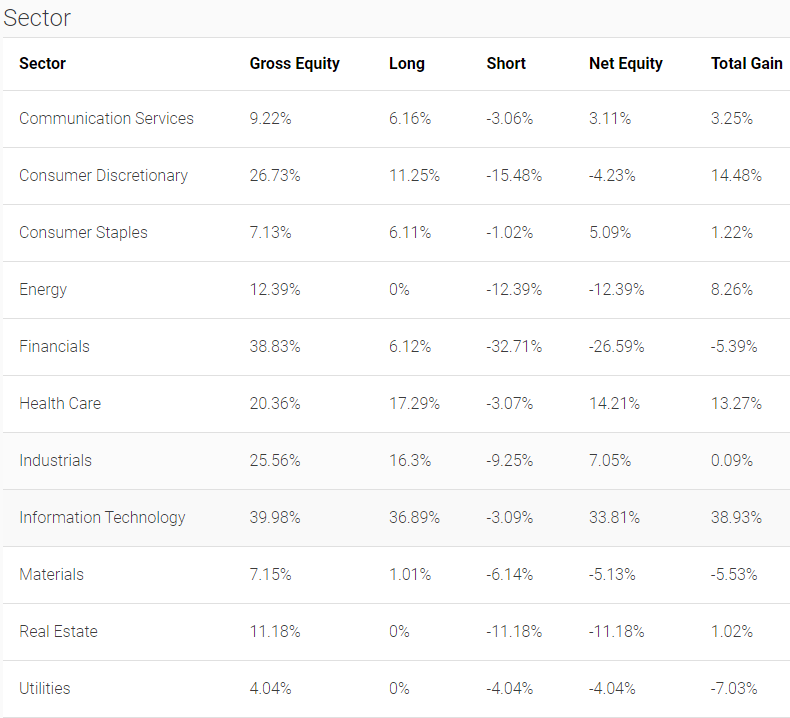
Lastly, we showcase a detailed breakdown by sector, exposure and cumulative gain.
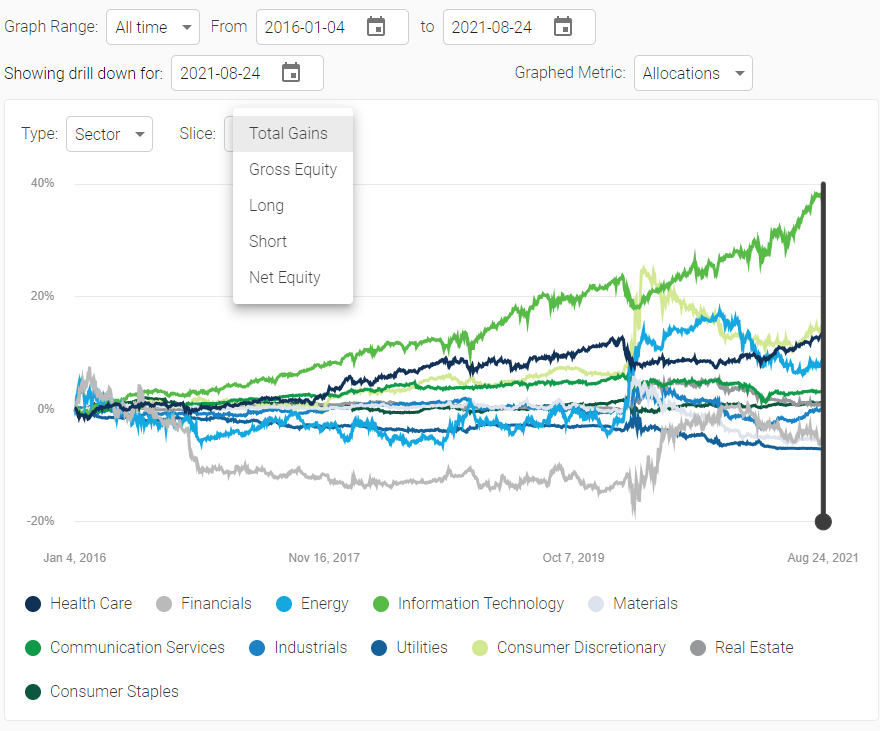
Graphed View
Select "Allocations" from the dropdown to access the chart plot. You can filter by Geography and Sectors and select individual charts at the bottom. The data is sliceable by different metrics - exposure, performance and allocation.