An overview of Boosted.ai's Driver Values and Driver Scores.
Table of Content
- What is Driver Value?
- What is Driver Score?
- How does Driver Score relate to Stock Rating?
- What is Driver Rating?
- How to use Driver Value, Driver Scores, and Driver Ratings?
What is Driver Value?
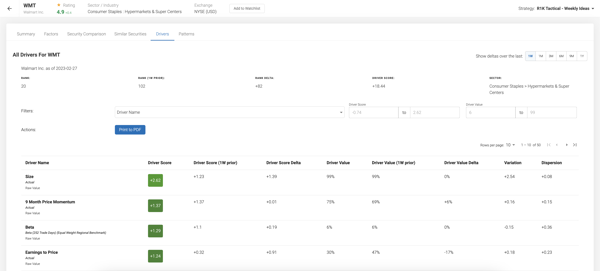
Driver Value is a percentile measure of a stock or strategy's exposure to a feature, which is one of many inputs that comprise a model. Because different features are measured differently, we standardize the scale by showcasing a feature's value through percentiles.
Example:
Walmart has a 9 Month Price Momentum Driver Value of 75%, meaning that its 9 Month Price Momentum is higher than 75% of stocks in its universe. Taking a look at the Driver Value (1W prior), its 9 Month Price Momentum is 6% higher than the week before, which tells us its momentum is increasing.
What is Driver Score?
Driver Score is a measure of how favorably the machine views a feature's Driver Value based on machine learning; this is used to explain how different features contribute to a stock's rating. A Driver Score is either positive or negative, where a positive Driver Score means a feature is providing a bullish (buy) signal and a negative value means a bearish (sell) signal). Driver Score does not have a set scale, so a larger positive value means a more bullish and a larger negative value means more bearish.
Example:
Revisiting Walmart, its 9 Month Price Momentum has a Driver Score of +1.37, meaning it is contributing a bullish (buy) signal of 1.37.
How does Driver Score relate to Stock Rating?
As covered above, every feature contributes a Driver Score that is either positive or negative. The machine then sums up the Driver Score for every single feature within a stock, which results in a stock-level Driver Score. The machine numerically ranks all the stocks in the universe based on their stock-level Driver Scores and provides a Stock Rating based on their rankings.
Example:
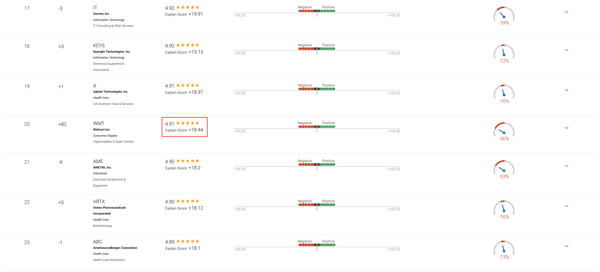
Summing up the Driver Score for all its features, Walmart has a Stock Driver Score of +18.44, which is the 20th highest in the universe. Walmart's stock ranking of 20 gives it a Stock Rating of 4.91 stars.
The example below says Explain Score, which is an outdated term for Driver Score; this will be amended in a future update.
Driver Rating
To help better interpret the impact of Driver Score on Stock Rating, we created Driver Rating, which is a letter grade assigned to each feature and feature roll-up. Driver Rating is formulated by normalizing Driver Scores, turning them into a percentile measure; this makes the Driver Score scale constant. The highest Driver Score across all stocks and features becomes the upper bound (100th percentile) and the lowest Driver Score becomes the lower bound (0th percentile); all other Driver Score percentiles are relative to the upper and lower bound.
A letter grade is then assigned based on the following:
- A: 86th - 100th percentile
- B: 71st - 85th percentile
- C: 51st - 70th percentile
- D: 31st - 50th percentile
- E: 16th - 30th percentile
- F: 0th - 15th percentile
If a feature has a Driver Rating of A, then we know it is a top signal for why the machine thinks the stock will outperform. On the contrary, a Driver Rating of F tells us the feature is a top signal for why the stock will underperform.
How to use Driver Value, Driver Scores, and Driver Ratings?
Boosted Insights is not meant to be a silver bullet for making winning investments, but rather a tool that augments our process. Not every machine pick is going to be correct; however, we have the ability to audit the machine's recommendations.
As we know, the machine is trained on historic data, which means it does not learn from current market conditions as quickly as a human would. We can use Driver Value, Driver Scores, and Driver Ratings to determine whether a machine's recommendation or rating is justified by researching news that would impact the top features that a stock is heavily exposed to.
Example:
Let's look at the ranking of this R1K strategy. We see Fasten is the 20th-ranked stock in the universe with a Driver Score of +22.97.
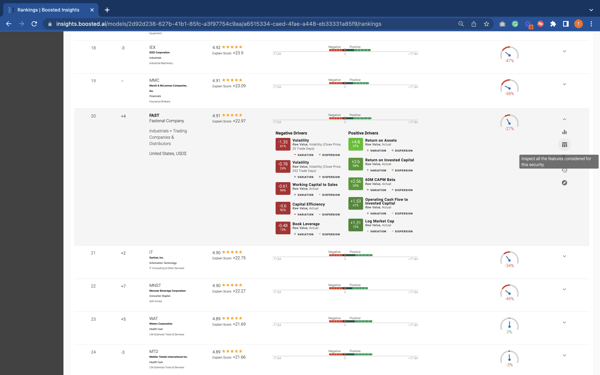
Opening up the Drivers page using the 2nd icon from the top of the details list, we see Return on Asset is the top individual feature for why the machine thinks Fastenal will outperform with a Data Score of +4.8. The feature's Data Value is in the 97th percentile, meaning Fastenal has a better Return on Asset than 97% of stocks in the R1K; this also tells us the machine views high Return on Asset as a strong signal for outperformance.
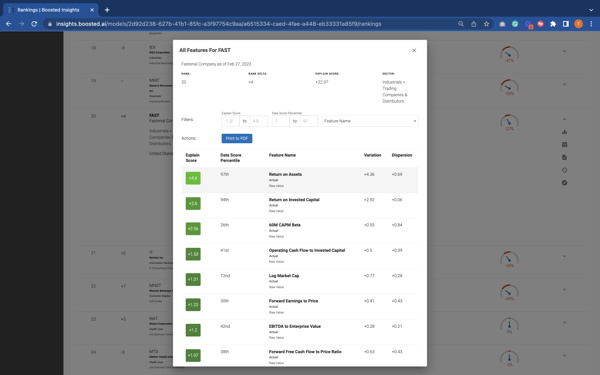
Let's say we conduct some research and discover news that Fastenal is making an investment that would drastically decrease the company's ROA, which would then decrease the feature's Data Value and, subsequently, Data Score. If the Data Score is halved (-2.4), that would bring the stock's total Data Score to +20.57, moving its ranking down to 32. Now, Fastenal may not be as compelling of an investment.
In conclusion, understanding Driver Value and Driver Scores lets us decipher why stocks are ranked and rated differently. It also helps us stay on top of the news that may impact features that our stocks have high exposure to. Incorporating this due diligence into our process will give us better conviction on trading AI stock picks.