What is Equity Explorer?
Equity Explorer is a feature that gives you more context around the machine’s decision-making process, so you can better evaluate and act on its outputs. It also indicates whether live predictions are valid for specific stocks, which takes the guesswork out of whether a model is still working or not.
What can you do with Equity Explorer?
- Stock Screening - Understand how fundamental and technical variables contribute to buy/sell signals at the stock level.
- Market Awareness - Stay on top of your model’s validity and be aware of changes in market conditions.
- Stock Discovery - Discover other stocks that follow a target pattern and identify industry/sector trends.
Content
- Navigating to Equity Explorer
- Insights from Equity Explorer
- Cluster Signals and Instance %
- Market Awareness
- Sorting and Investment Horizon
- Stock Discovery
1. Navigating to Equity Explorer
You can find Equity Explorer through Rankings. Find a stock you’re interested in then expand the row. Click on the Equity Explorer icon on the bottom right to open the feature.
Note, Equity Explorer is only enabled for models retrained after 6/15/2022. If you don’t see Equity Explorer, duplicate your model. Once live, you should be able to see the icon then.
You can view Equity Explorer using a list view (default) or card view. You can switch between the two using the option highlighted below. 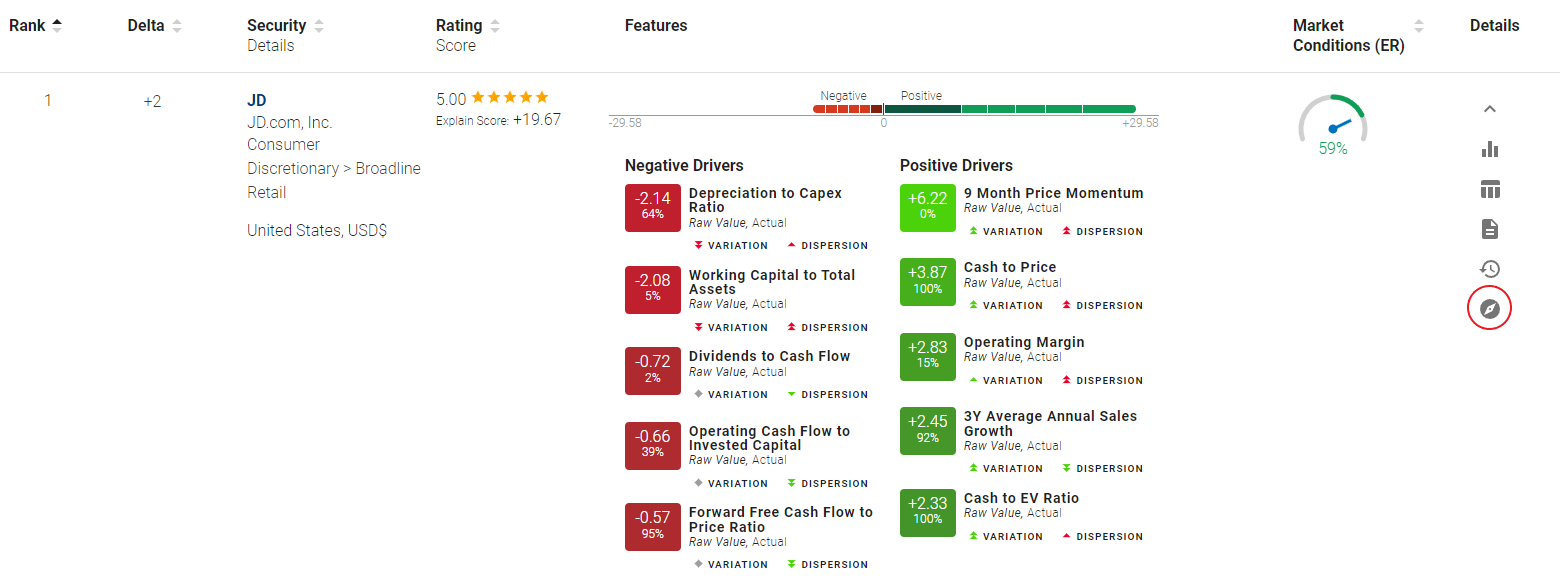
List View
Card View
2. Insights from Equity Explorer
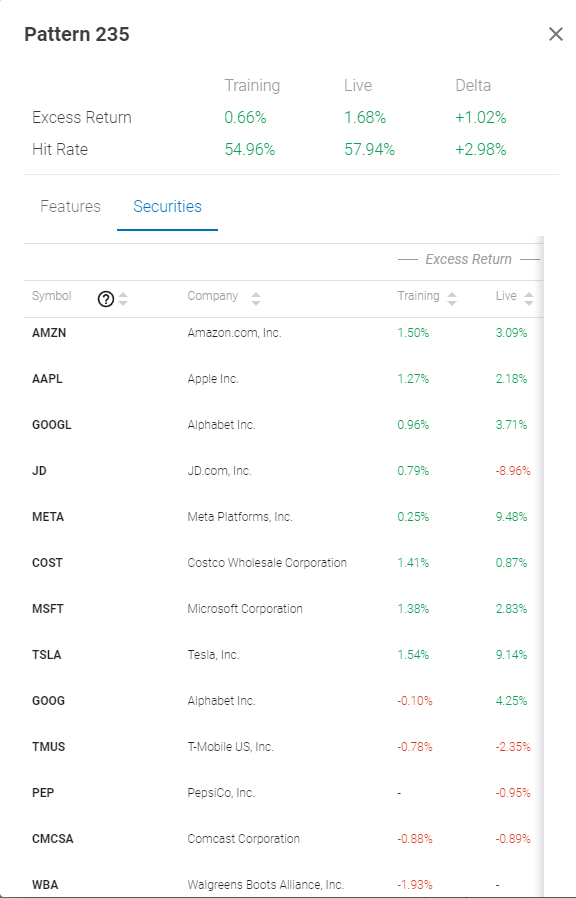
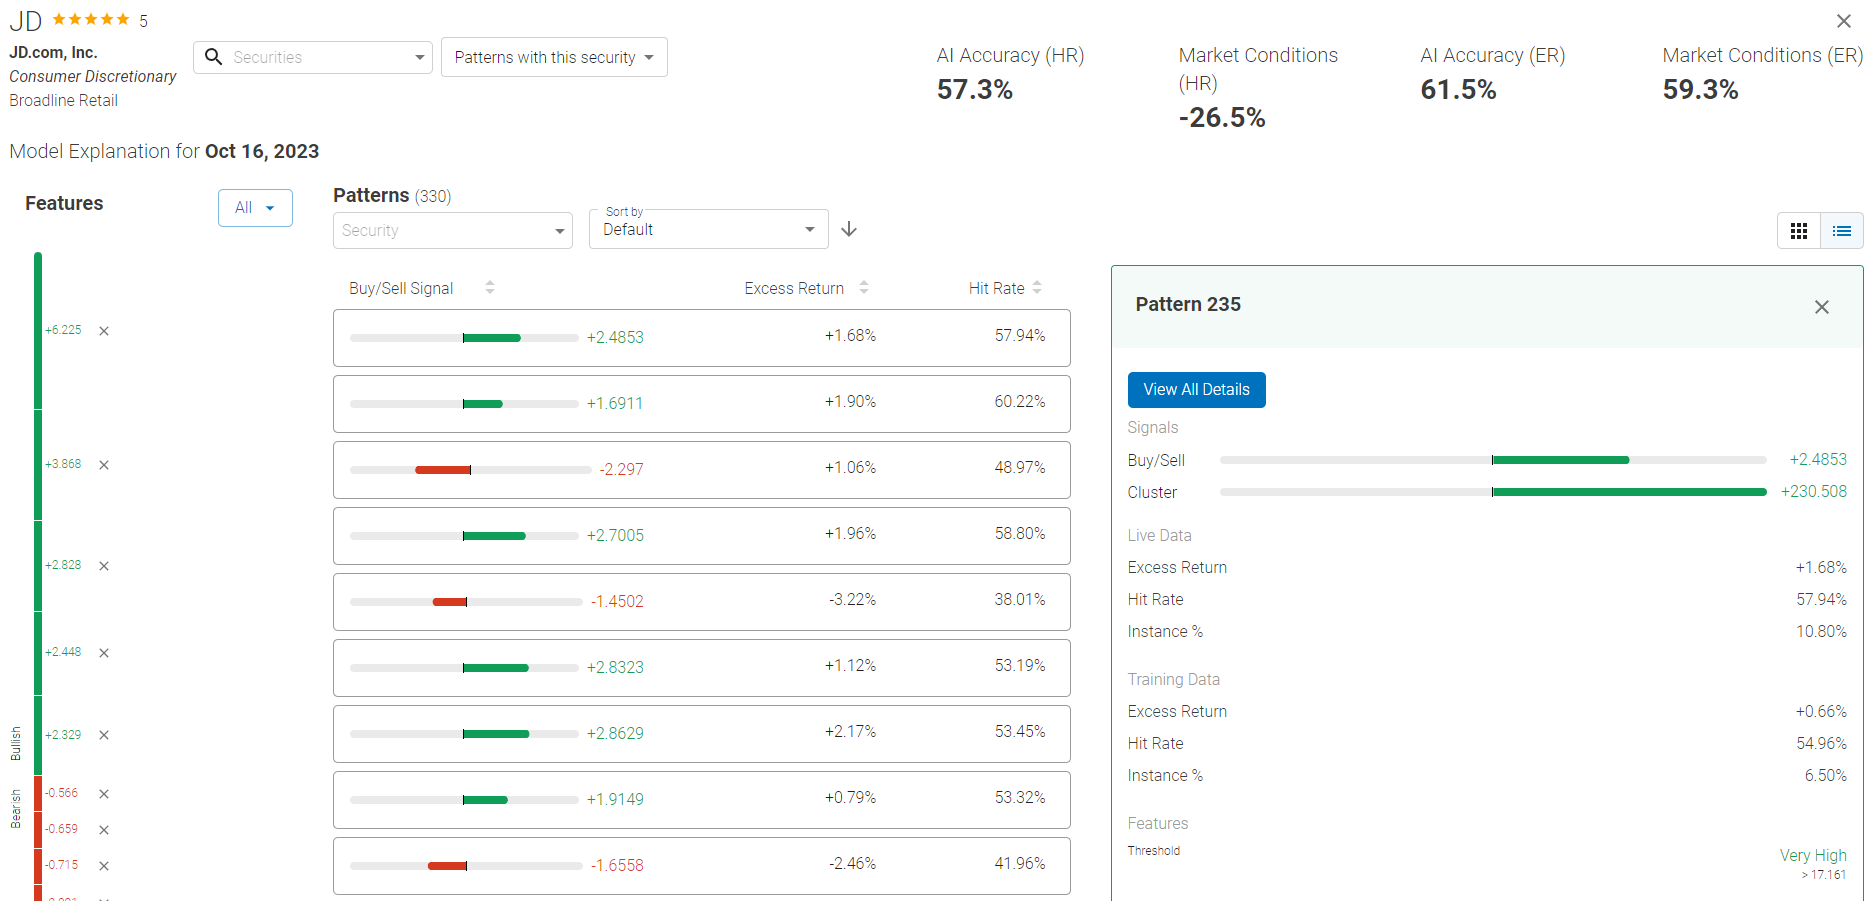
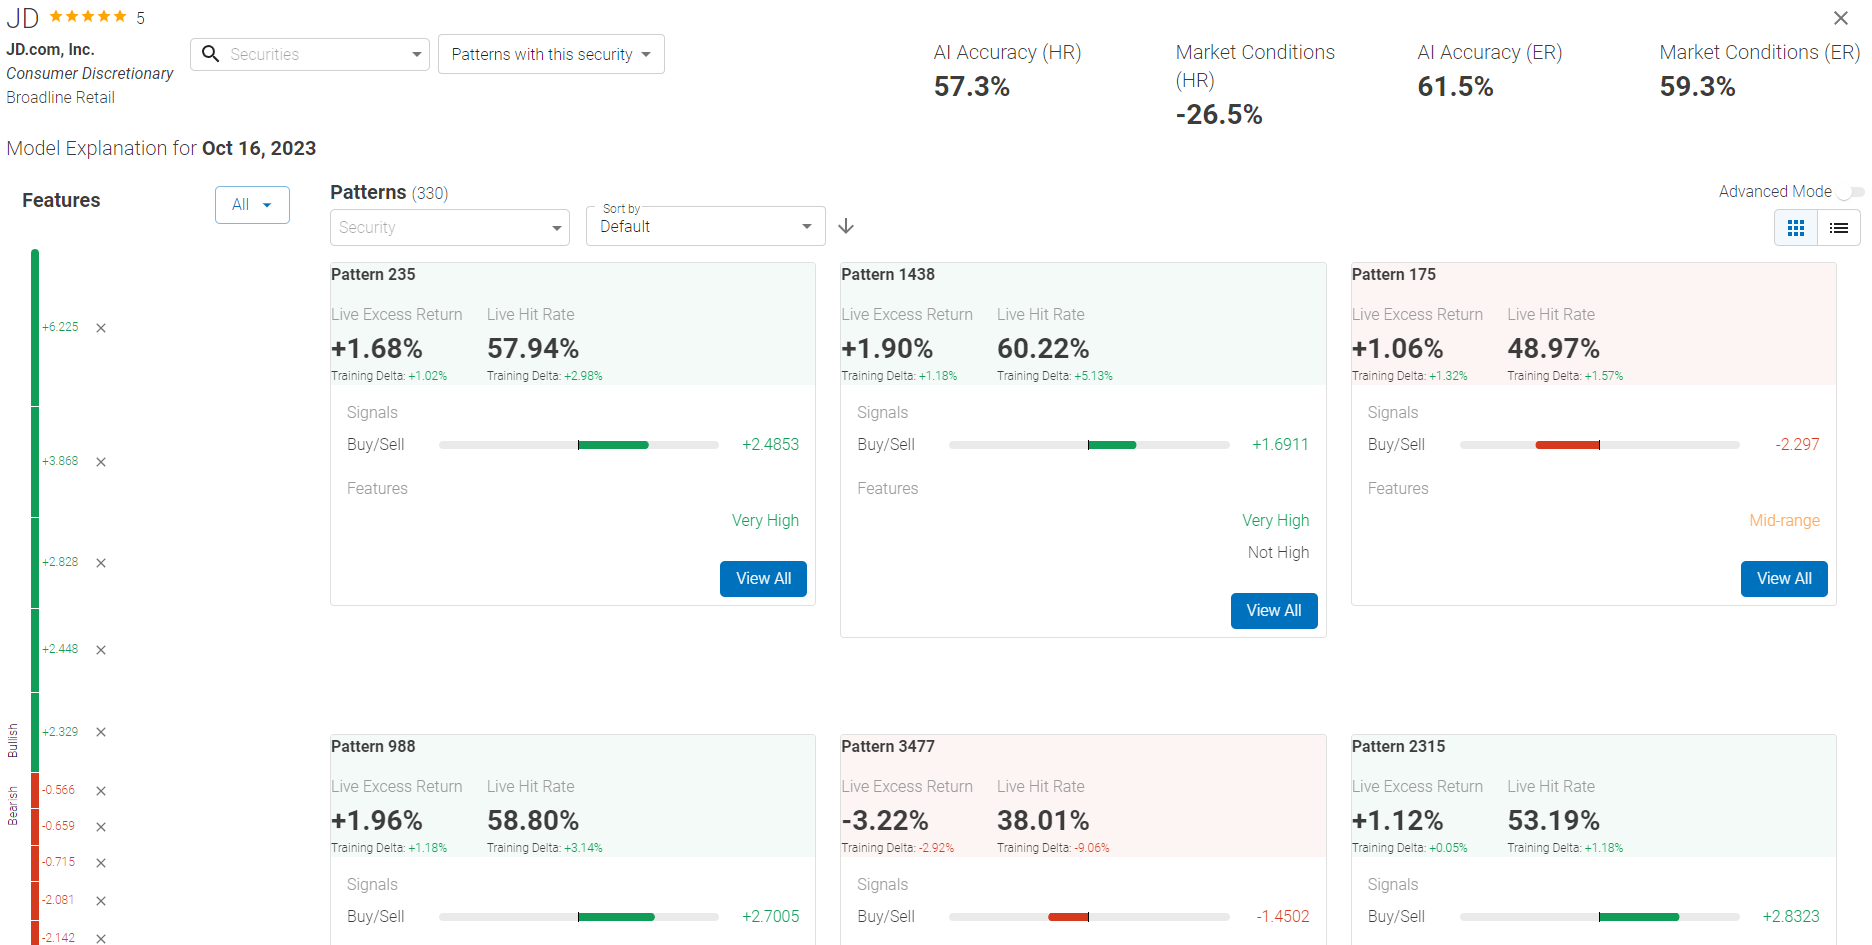
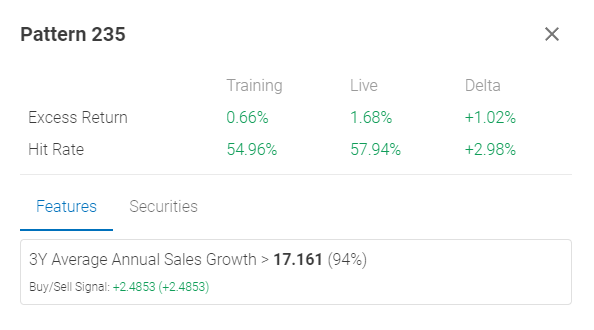
Equity Explorer provides insights at the pattern level and stock level. You can look at patterns to see how combinations of variables generate buy/sell signals and the performance of these patterns. Overall, the patterns, you get an overview of a model’s performance and showcase to you what went into specific stock’s rating.
Equity Explorer Key Metrics
- Batting Average - Measures the accuracy of the model’s live predictions. A correct prediction (hit) is when a pattern’s buy/sell signal and live outcomes agree with each other, and an incorrect prediction (miss) is when they disagree.
- Minimum score: 0%, meaning 100% of the predictions made in training are wrong.
- Maximum score: 100%, meaning 100% of the predictions made in training are correct.
Batting Average = Sum# of Hits / Sum # of Patterns
- Slugging Percentage - A metric that evaluates the machine’s live recommendations using predictions made during training adjusted for accuracy and signal strength (Cluster Score). Slugging Percentage is best used alongside Rankings because it lets you compare training and live predictions to see how well the model is doing for a particular stock. Note, just because training and live outputs disagree with each other does not mean the model is broken; it could be an indicator of a mean reversion.
- Minimum score: -100%, meaning you should sell/short the stock given the stock’s live results. This is an aggregate score of the machine predicting sell patterns correctly and buy patterns incorrectly.
- Maximum score: 100%, meaning you should sell/short the stock given the stock’s live results. This is an aggregate score of the machine predicting buy patterns correctly or sell patterns incorrectly.
Slugging Average = (Sum Cluster Scores of Hits - Sum Cluster Scores of Misses) / Sum Absolute Value of Cluster Scores
Hit Rate vs Excess Return (Batting Average/Slugging Percentage)
As you may have noticed, there are Batting Averages and Slugging Percentages for both Hit Rate and Excess Return. Both metrics give similar insights into the validity of the model’s predictions. If you are evaluating prediction quality, then look at Hit Rate. If you are evaluating excess performance, then look at Excess Return.
Rankings vs Equity Explorer Key Metrics
A stock’s ranking is based on signals generated using features learned from the last retraining period. Although Rankings are updated every rebalance period, how the machine evaluates features does not change until the next retraining. The addition of Batting Averages and Slugging Percentages lets you know how well the model is performing live, which allows you to better determine if the current model is working for a particular stock.
What does Batting Average tell us?
- Batting Average (High) - When Batting Average is high, the data that the machine was trained on is working well, so you should feel more confident in a stock’s ranking as prediction accuracy is high.
- Batting Average (Low) - When Batting Average is low, the data that the machine was trained on is not working well, pr there is likely a regime shift. In these situations, you’d have to evaluate whether or not these market conditions will persist. If you believe market conditions will revert, then the stock could be a buying opportunity later. However, if you don’t believe market conditions will revert, then evaluate further.
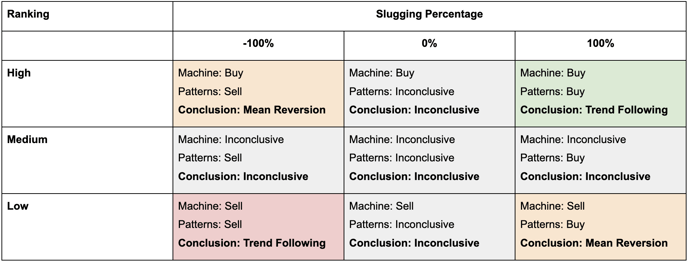
What does Slugging Percentage tell us?
Slugging Percentage is most useful when used alongside Rankings.
- If you think current market conditions will persist:
-
- Buy - Highly ranked stocks with high slugging percentages
- Sell - Lowly ranked stocks with low slugging percentages
- If you think market conditions will revert:
- Buy - Highly ranked stocks with low slugging percentages
- Sell - Lowly ranked stocks with high slugging percentages
- If you are unsure (not wanting to make extreme bets):
- Buy - Highly ranked stocks with medium (0%) slugging percentages
- Sell - Lowly ranked stocks with medium (0%) slugging percentages
 Hit Rate vs Excess Return
Generally, hit rate and excess return move in the same direction and tell us the same thing about a stock/pattern. Hit rate would matter more if you’re looking for accuracy, and excess return if you’re looking to outperform the benchmark.
Rankings - Excess Return Slugging Percentage Gauge
We added the Excess Return Slugging Percentage Gauge to Rankings to let you quickly see the validity of the model’s rankings. Overall, using the gauge, you can evaluate if the stocks that are ranked high/low (buys/sell) are trend following. If the gauge agrees with the ranking, then it would further solidify the machine’s recommendation. However, if the gauge moves opposite of what the ranking says, then it boils down to evaluating whether a reversal is expected to happen.

Cluster Signal - Equity Explorer reveals the most unique patterns, but behind the scenes, there are thousands of other patterns that share some similarities. The cluster Signal is the total buy/sell rating for all patterns that are very similar and include a particular combination of features.
Instance % - A metric that shows how frequently the stock falls into the pattern.

4. Market Awareness
Equity Explorer lets you find changes in market conditions by surfacing patterns that worked in training but not live, or vice-versa. This is a worthwhile exercise if you have very low batting averages.
Market Shift Indicators
- Large Deltas with Hit Rate/Excess Return Between Training and Live - Big changes with hit rates and excess returns between training and live period are indicators that something changed in the market causing certain features/patterns to not be accurate predictors of performance.

In this example, Volatility (20D) > .98 was generating 7.93% of excess return and had positive returns 53.3% of the time during training. However, while the model is live, this same pattern is now generating negative excess return and is only having positive returns 8.24% of the time. This tells us Volatility (20D) is no longer a positive driver.
- Divergence Between Excess Return and Buy/Sell Signal - When excess return and the buy/sell signal are opposite of each other, it means that the original training pattern is not performing under the current market conditions. Depending on whether you believe current conditions will persist, you could either adjust the model or ignore and continue with the current signals.

In this example, Pattern 1457 signaled to buy during the training period. However, in the current market, it is generating negative excess return and yielding positive return only 8.24% of the time. Based on the current market, it should be signaling sell, but the machine has not been retrained yet.
- Large Delta with Instance % Between Training and Live - When there is a large delta with Instance %, it means either the company or market is undergoing changes that is causing the stock to fall into or out of the pattern more frequently.

In this example, this stock had low Beta (Sector) and Analyst Expectations 50.97% of the times during training. Currently, it is only 38.03% of the times. This tells us that Beta (Sector) and/or Analyst Expectations have improved.
5. Sorting and Investment Horizon
Sorting
You can quickly find performant patterns and market shift indicators using sort. By default, the machine sorts by patterns it finds most interesting.

Investment Horizon
The investment horizon option lets you set the live evaluation period. Batting average, slugging percentage, and patterns’ live metrics will change based on the investment horizon.

6. Stock Discovery
Once you find a pattern of interest, you can use it to search for other stocks from the Securities tab within a pattern. From there you can see the hit rates and excess returns. Start/End indicates the first and last time a stock met the pattern within the training and live period.