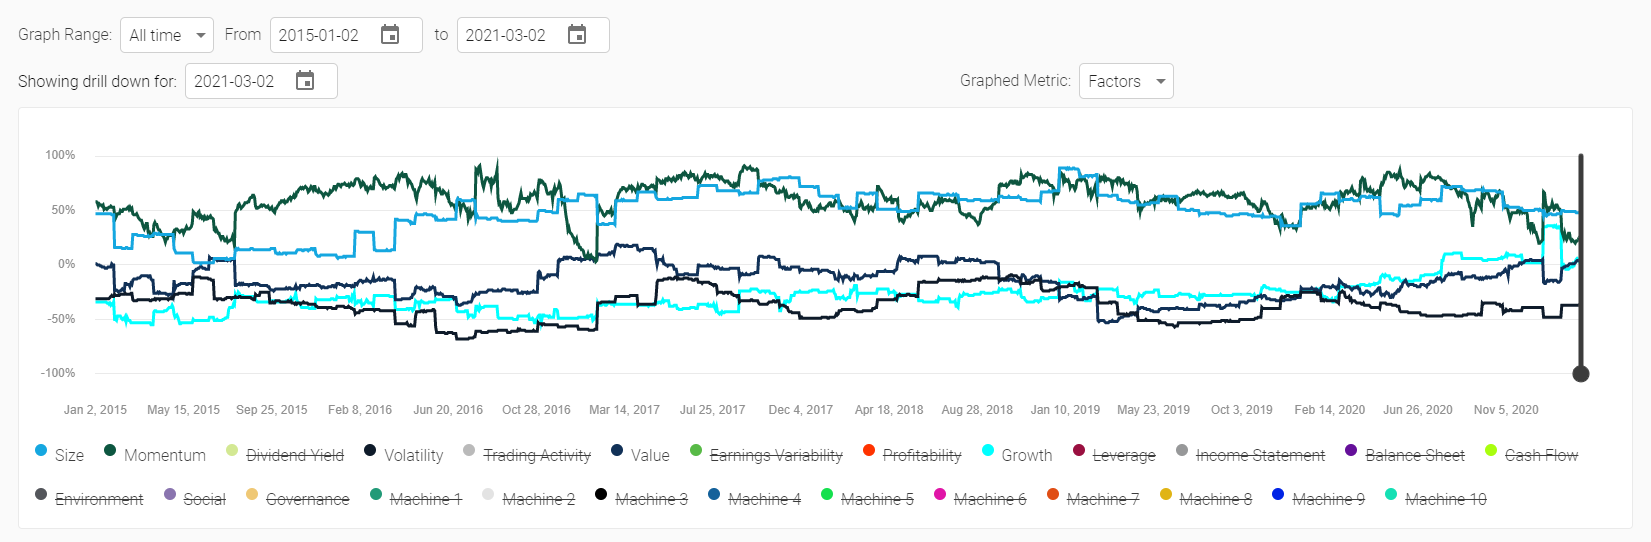
Factors shows the factor exposure of the portfolio over the selected time period. The factor scores are shown on a Z-Score basis, and the Z-Scores are calculated versus the stock universe at that moment in time. This means that, on average, stocks will average a factor score of 0 and +100% means you are overexposed to that factor (relative to the average) by 1 standard deviation and a score of -75% means you are underexposed by 0.75 standard deviations.
Factor exposure of the portfolio is calculated by summing the individual score of each stock multiplied by the percent weight in the portfolio. Factor exposures are calculated on a daily basis, but the chart can appear sawtooth in nature based on the rebalance period of the portfolio.
The factors labelled Machine 1 through 10 are machine learning based factors. We are not able to name these factors, but what we know is that Machine 1 is the largest risk factor and Machine 2 is the second largest and is completely uncorrelated to Machine 1. Machine 3 is the 3rd largest, 4 is 4th largest, etc, etc. You might imagine that Machine 1 is “market” risk and Machine 2 is “interest rate risk”, depending on the universe. These factors can change over time though, as they are calculated at each rebalance period and so what Machine 2 represents can change over time, the only thing that remains constant is that it is the 2nd most important risk factor (i.e. it could change from “interest rate risk” to “pandemic risk” during the COVID-19 crisis).
Factor exposures can be constrained through the portfolio settings menu.