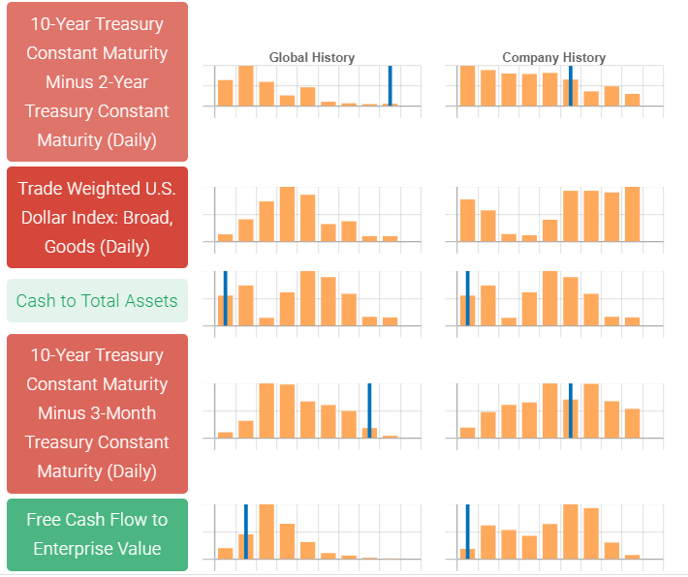
What do the orange bars and blue lines represent on the Trades and Rankings pages?
The orange bars under Global History show where all of the stocks in the universe fall on the given feature. The blue line is where the given stock is at that time. The chart under Company History shows where the stock is relative to its own history. In both cases the numbers are computed using z-scores.
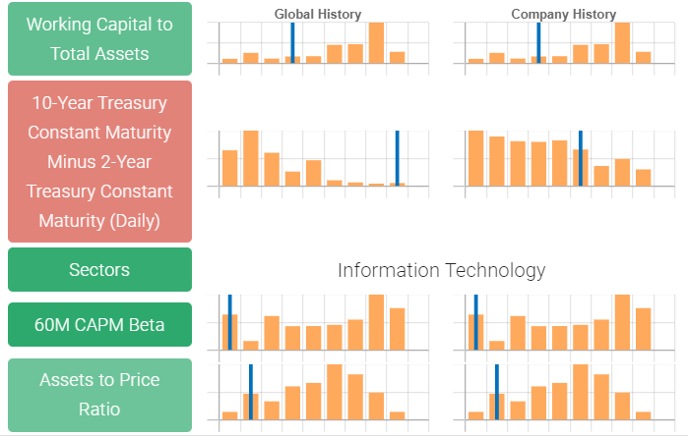
Why are some features green and others red on the rankings tab?
Overall, these are the features that drove the machine’s ranking on each individual stock. Green means the machine viewed the given feature as a positive. Red means that the feature was a negative. The darker the color the more positive or negative the factor at that given time according to the machine.
Why is my #1 holding not the top ranked stock?
The machine uses a two step process. First, the machine ranks all of the stocks in your universe from first to last. Second, based on your goals and portfolio settings, it constructs a portfolio. The machine will change the holdings and weights in your portfolio to solve for lower risk if you selected that optimizer, for example.
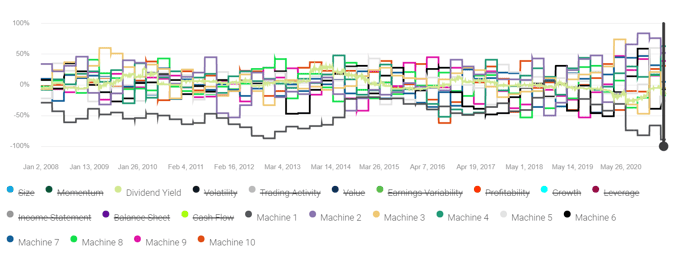
Why are some factors crossed out on the Factor drop down menu under Graphed Metric?
The crossed out factors are simply the ones that aren’t showed on the chart. You can add and remove any of those listed by clicking on them.
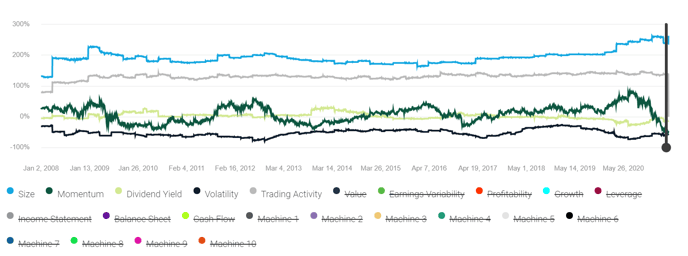
What are Machine 1 - Machine 10 on the Factor drop down menu under Graphed Metric?
Machine 1 - Machine 10 are factors that your portfolio is exposed to that the machine is picking up. For example, in March of 2020 Machine 1 was likely COVID-19. The machine was picking up a pattern between airline stocks, cruise stocks, restaurant stocks, etc. There are actually many other factors that the machine is tracking. Right now, WWIII might be factor 125, but it would quickly move into the top 10 if war broke out. These machine learned factors help you to identify and potentially control factors that your portfolio is exposed to that you may not be tracking.
Basically Machine 1 - 10 are the top 10 risk factors as defined by the machine at that moment in time. In reality they are a little bit closer to "here are the top 10 baskets impacting the market at this moment in time". Each basket is successively less important than the last in impacting market performance and there is no guarantee that they remain important going forward. That said, the fact that performance and volatility drop when you reduce your exposure to these baskets does indicate that they work going forward. So the way to think about it is Machine 1 might have been the work from home basket in peak COVID-19, but in normal times Machine 1 is probably 'risk on/off' and Machine 2 is Momentum or similar. That's why if you go all the way down to Machine 10 you're neutralizing against a lot of these baskets - so it makes sense your performance drops. If you only went 1, 2, 3 you'd probably capture a lot of the risk reduction (i.e. all 10 moved you from 14% to 6.5%, doing the top 3 might move you from 14% to 9.5%) without the same amount of performance hit.
Why didn’t my duplicate model get the same result?
Our machine learning algorithms are non-deterministic, so some variation is expected if you re-run them.
Overall, the machine is trying to find a "global" solution to the problem of "what is the right way to use this data to make money". The problem is, it can get stuck in a local minimum. The way that the majority of these algorithms work is you introduce a level of randomness to them to try and make sure it gets out of these local minimums - but that is not a guarantee. As a result you end up with different results. Overall, the results from a quantile perspective are likely to be very similar. But if you are doing a more concentrated approach (i.e. pick the top security only) then the results can end up pretty different.
.png?width=382&name=pasted%20image%200%20(2).png)
The machine moves along the curve trying to find the global minimum, but you can see that it could get stuck at the local minimum because in order to get to the true global one it would need to climb that hill between local minimum and global maximum. So if it attempted too small a jump and ended up between global maximum and local minimum it would think "this result is worse, I better move left instead of right" and never get to the global minimum.