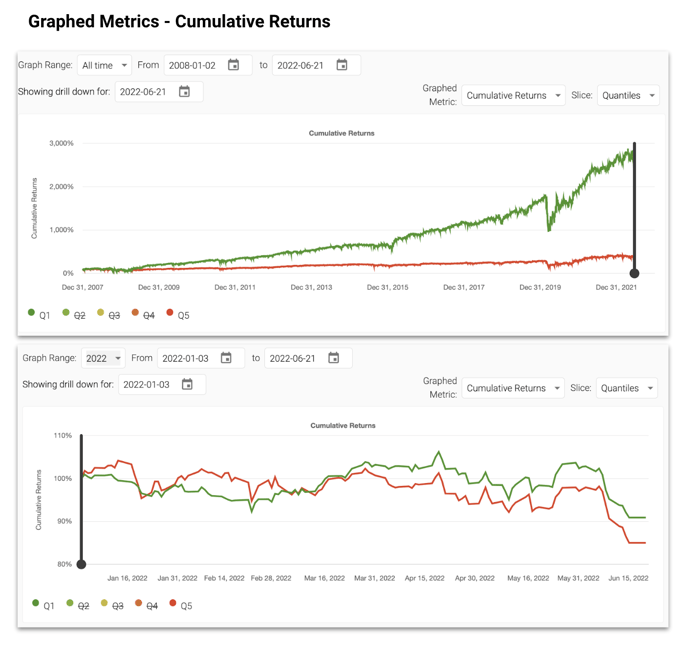
Once you click on the graphed metric cumulative returns, you will see cumulative returns for each of the quantile. Cumulative returns of Q1 should be above Q5, with Q1 increasing from bottom left to top right.

The initial graphed metrics will be for the all time graph range, you can click on a particular year to analyze the cumulative returns for that period.
Generally speaking, a good model will have good cumulative returns for Q1 as compared to Q5 in the most recent years.
