Signals shows the strength of your “signal” on any given rebalance day. Each data point represents the time range against which signal strength is evaluated, for example 21D represents 21 trading days or 1 month. If you had a 21D value of 5% on January 1, 2020 that means that from January 1, 2020 to January 31, 2020 (21 trading days) your picks were approximately 55% accurate (50% + the value shown on the chart). A value of -7% would mean 43% accuracy.
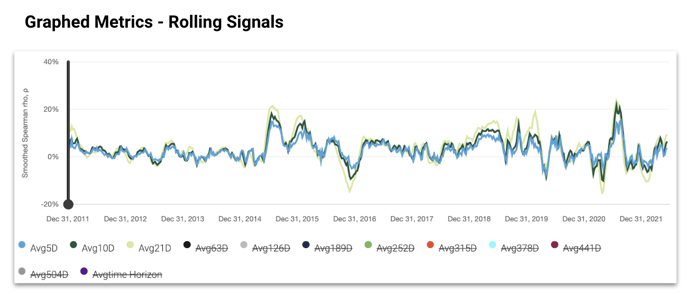
Rolling signals are identical to Signals, except they are smoothed over the trailing 12 periods. In the case of a daily rebalance model that means 12 trading days, in a monthly model that means a year (12 months). The smoothing is done on a simple basis (i.e. average of the 12 trailing results).