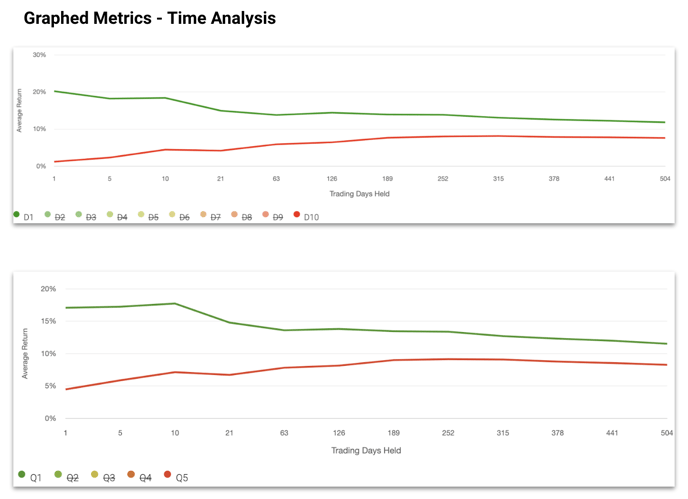
Using the graphed metrics, you can navigate to time analysis where the performance of the quantiles or deciles are mapped over time.

The quantile spread will usually become narrower over time as the signals tend to be much harder for longer time horizon as compared to shorter time horizon.
A good model will have Q1 or D1 above respectively Q5 and D10. You should pay close attention to the performance of the quantiles over your investment horizon.
