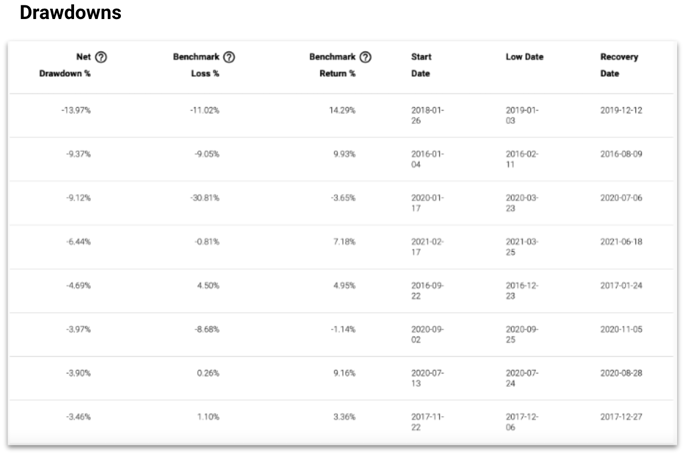
You can look at drawdowns in two ways:
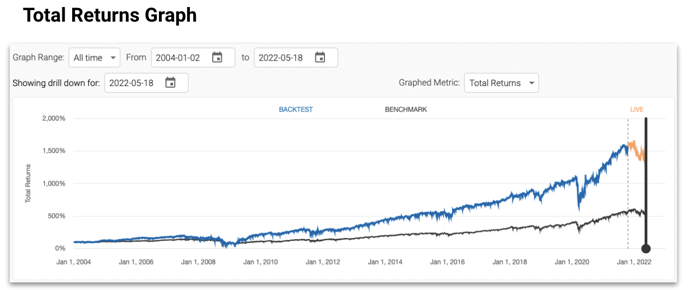
Total Returns Graph - You can quickly see any large drawdowns over the graph range. To see if the portfolio is in good shape, check the early years for any large dips. If part of the curve is flat, it means that the model was not invested at 100%.
Drawdowns - You can get to the Drawdowns from the navigation bar. Here, you’ll see all the drawdowns over the graph range.
- Net Drawdown % - % drawdown from peak to trough.
- Benchmark Loss % - Benchmark’s drawdown from peak to trough.
Benchmark Return % - Benchmark’s overall return from drawdown start to recovery date.