Our Factor Timing feature allows users to compare the predictions that the model makes about two factor quantiles or sectors (e.g. Momentum Q1 vs Momentum Q5, Technology vs Health Care). It also offers a visual way for users to delve deeper into the data of their models to surface aggregate or single stock opportunities and risks.
Comparison Charts
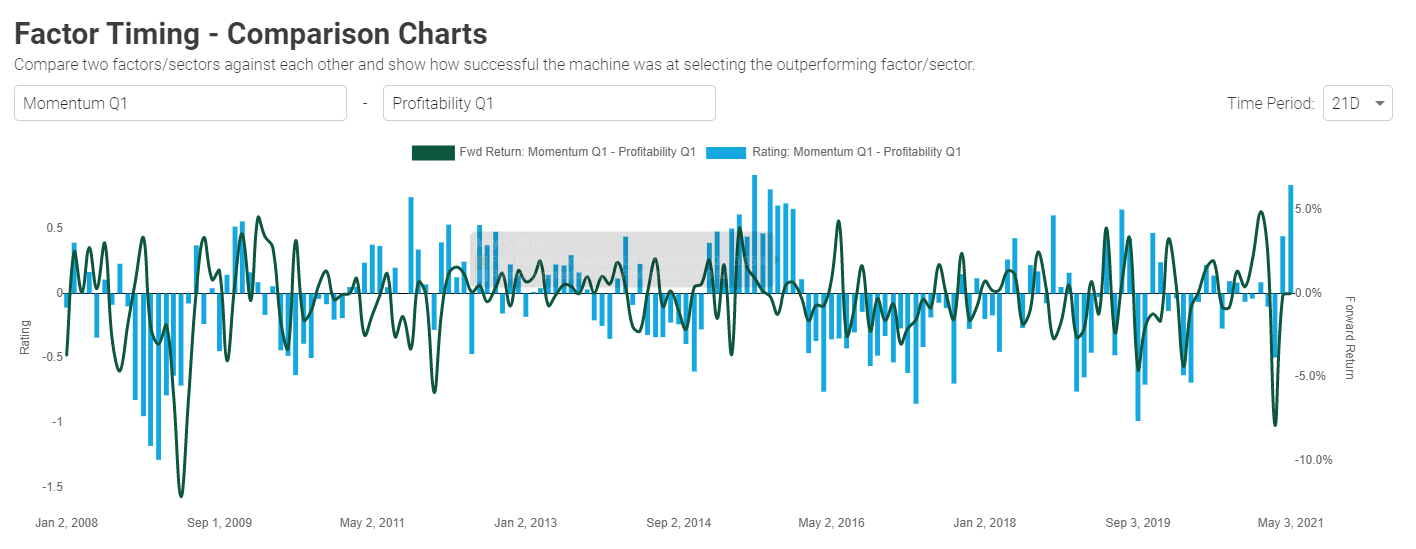
In the top panel, the comparison between two factors is plotted and is interpreted as per below:
- The blue bars represent the difference between the ratings of Momentum Q1 and Profitability Q1 (i.e. above x-axis means the model favors Momentum Q1 while below x-axis means the model favors Profitability Q1 at that date).
When the blue bar is above X axis, recommendation is to go Long Momentum Q1 and Short Profitability Q1. - The green line represents the forward return of the pair trade recommended above for the selected time period (e.g. 21D).
Below, the second section of the comparison charts page highlights the performance and predictions of your selections.
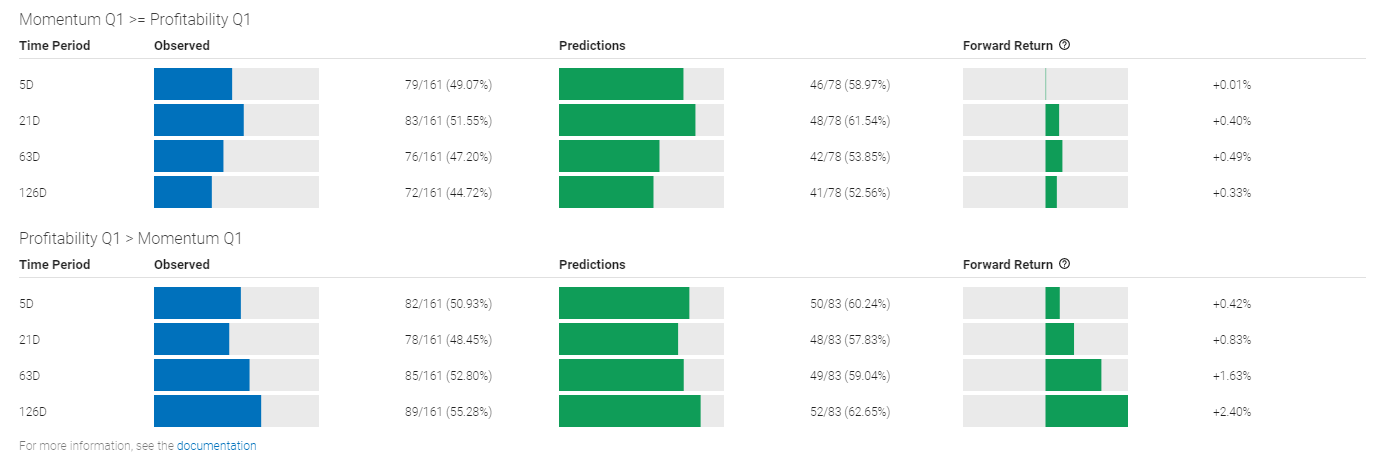
- The “Observed” column in the top panel show the number of times the actual return of Momentum Q1 was at least as great as Profitability Q1 and vice versa in the bottom panel. For example on the 21D basis MQ1 outperformed PQ1 83 out of 161 rebalancing periods (just slightly over half the time, just above 50%)
- The “Predictions” column shows in denominator the number of time the machine predicted MQ1 will outperform PQ1 (and vice versa for the bottom panel) and the numerator shows how many number of times the prediction was correct. For example on the 21D basis, MQ1 was predicted to outperform PQ1 78 times, and 48 times (61.54%) the prediction was correct.
- The "Forward Return" column then shows the average forward return when going Long Momentum Q1 while going Short Profitability Q1 (or vice versa on the bottom panel) by following the prediction. Using the same example, on a 21D basis, going Long MQ1 vs. Short PQ1 is generating 40 bps return at the time the snapshot was taken.
- Note that the time period equal to rebalancing period would give the most accurate representation of forward return projection. For example for Monthly rebalancing 21D would be the matching period in which return is calculated at the same frequency as rebalancing. Where as if 126D is used with Monthly rebalancing, the forward return would capture six rebalancing periods and if 5D is used, same trade will be entered and exited out of four times between rebalancing. All strategies are tradeable but the methodology would have to be taken into consideration.
Data Table
- Rating (star and value)
- Time Period
- Trailing Return (%) - actual return of the factor / sector before the last rebalance period
- Forward Return (%) - actual return from going long the specified factor at the last rebalance period
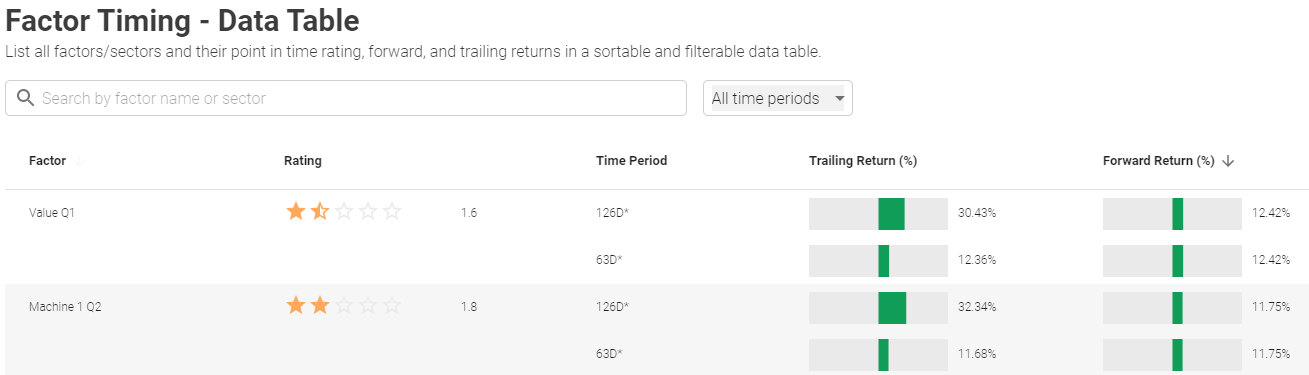
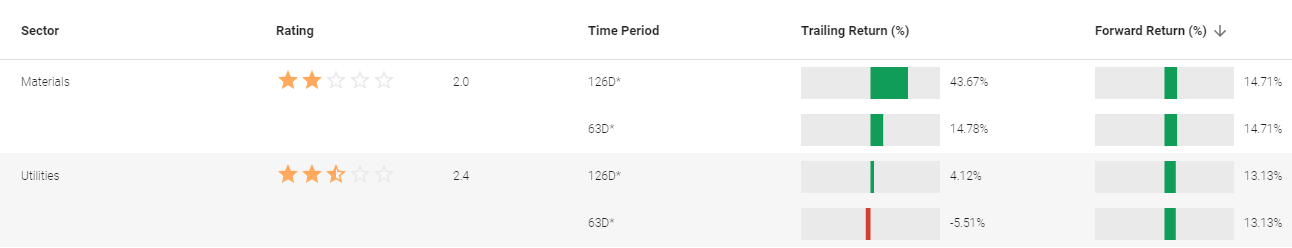
As shown above, both factors / sectors can be filtered and sorted with respective metrics showcasing how each factor / sector performed.
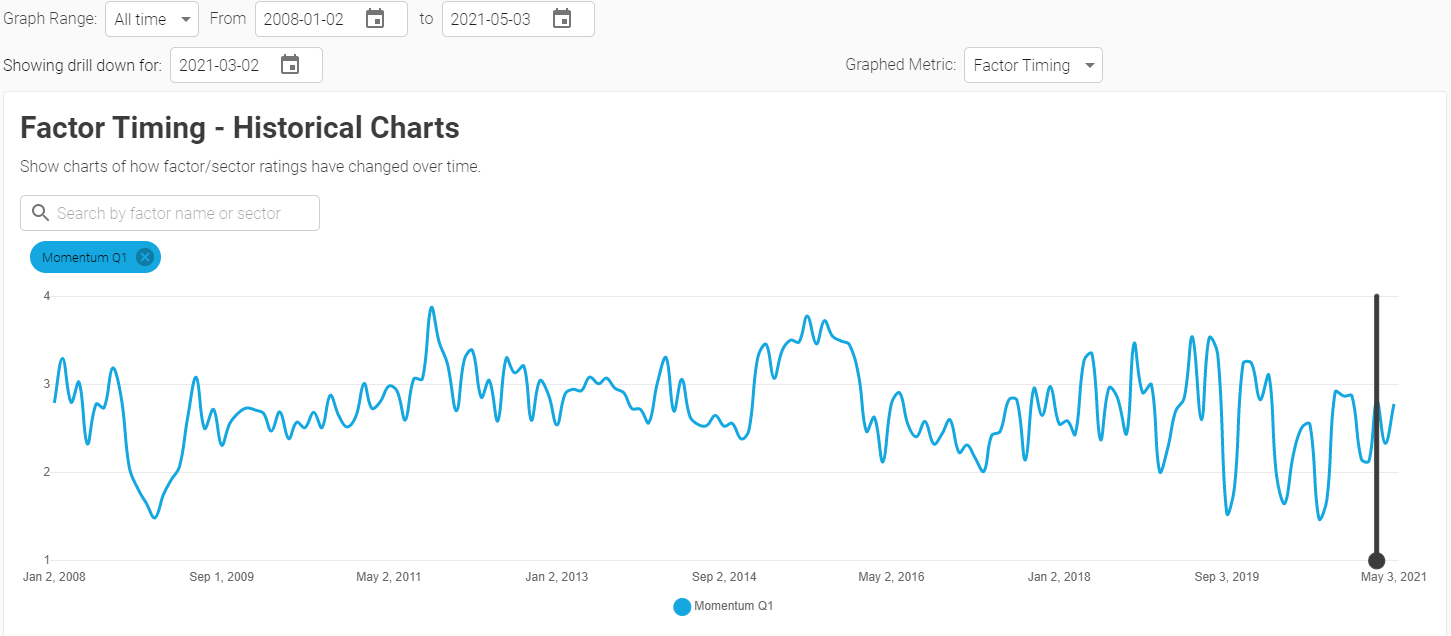
Historical Charts
This prompt serves as a shortcut to change the top panel view to "Factor Timing" in the "Graphed Metric" dropdown. The chart showcases the factor / sector rating over time.
Stock Data Table
This table lists all stocks and their current factor scores to see which stocks make up each factor/sector that the machine is making predictions on.
There are a number of filter options available:
- By Symbol
- By feature / quantile - note the unique "Any" and "All" choices, for example:
- Any Q1 will return all stocks that have any of the selected factors fall in Q1
- All Q1 will return only the stocks that have ALL selected factor dimensions fall in Q1
- Factor multiple picker - can have as many or as few factors as you'd like to look at
- Time period / sector / sub-sector
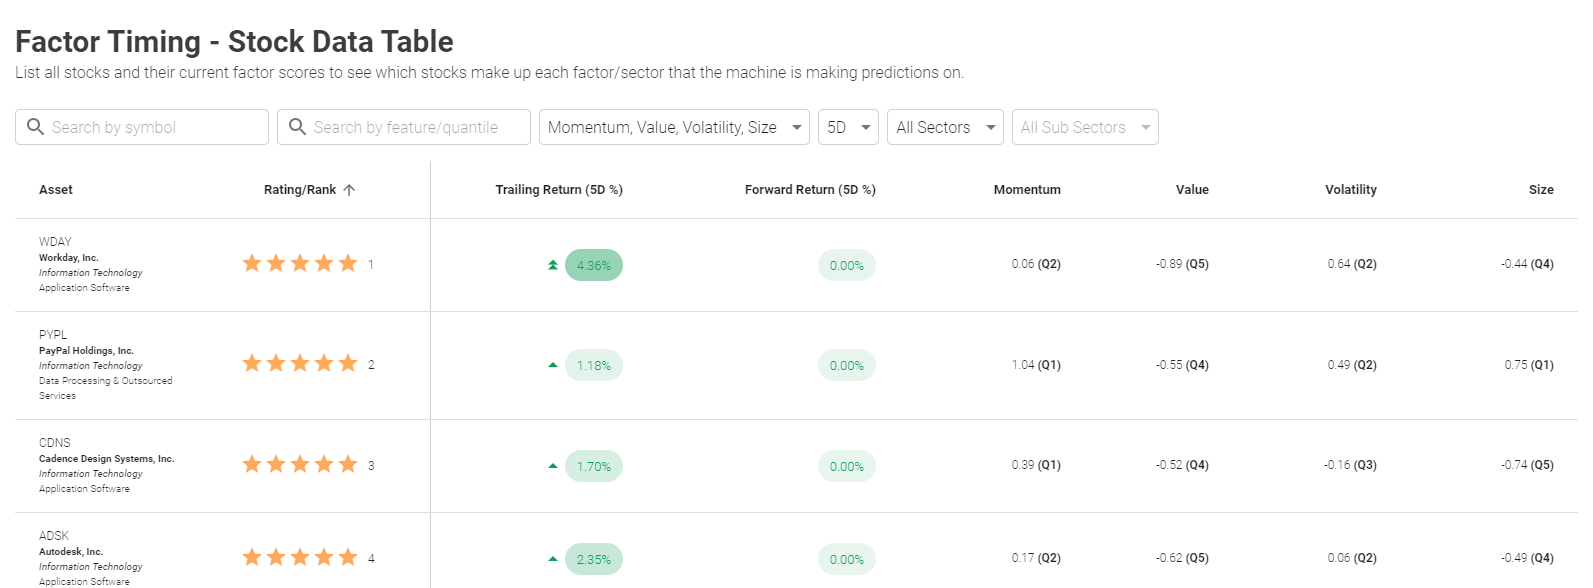
As per the screen above, you can filter by stock symbol and add / remove as many factors that are used in prediction to identify which are the most relevant for a particular security.