Ranked list of stocks sorted from best to worst based on the signals produced by the underlying model. Rankings are the primary source of security selection for the portfolio.
Overview:
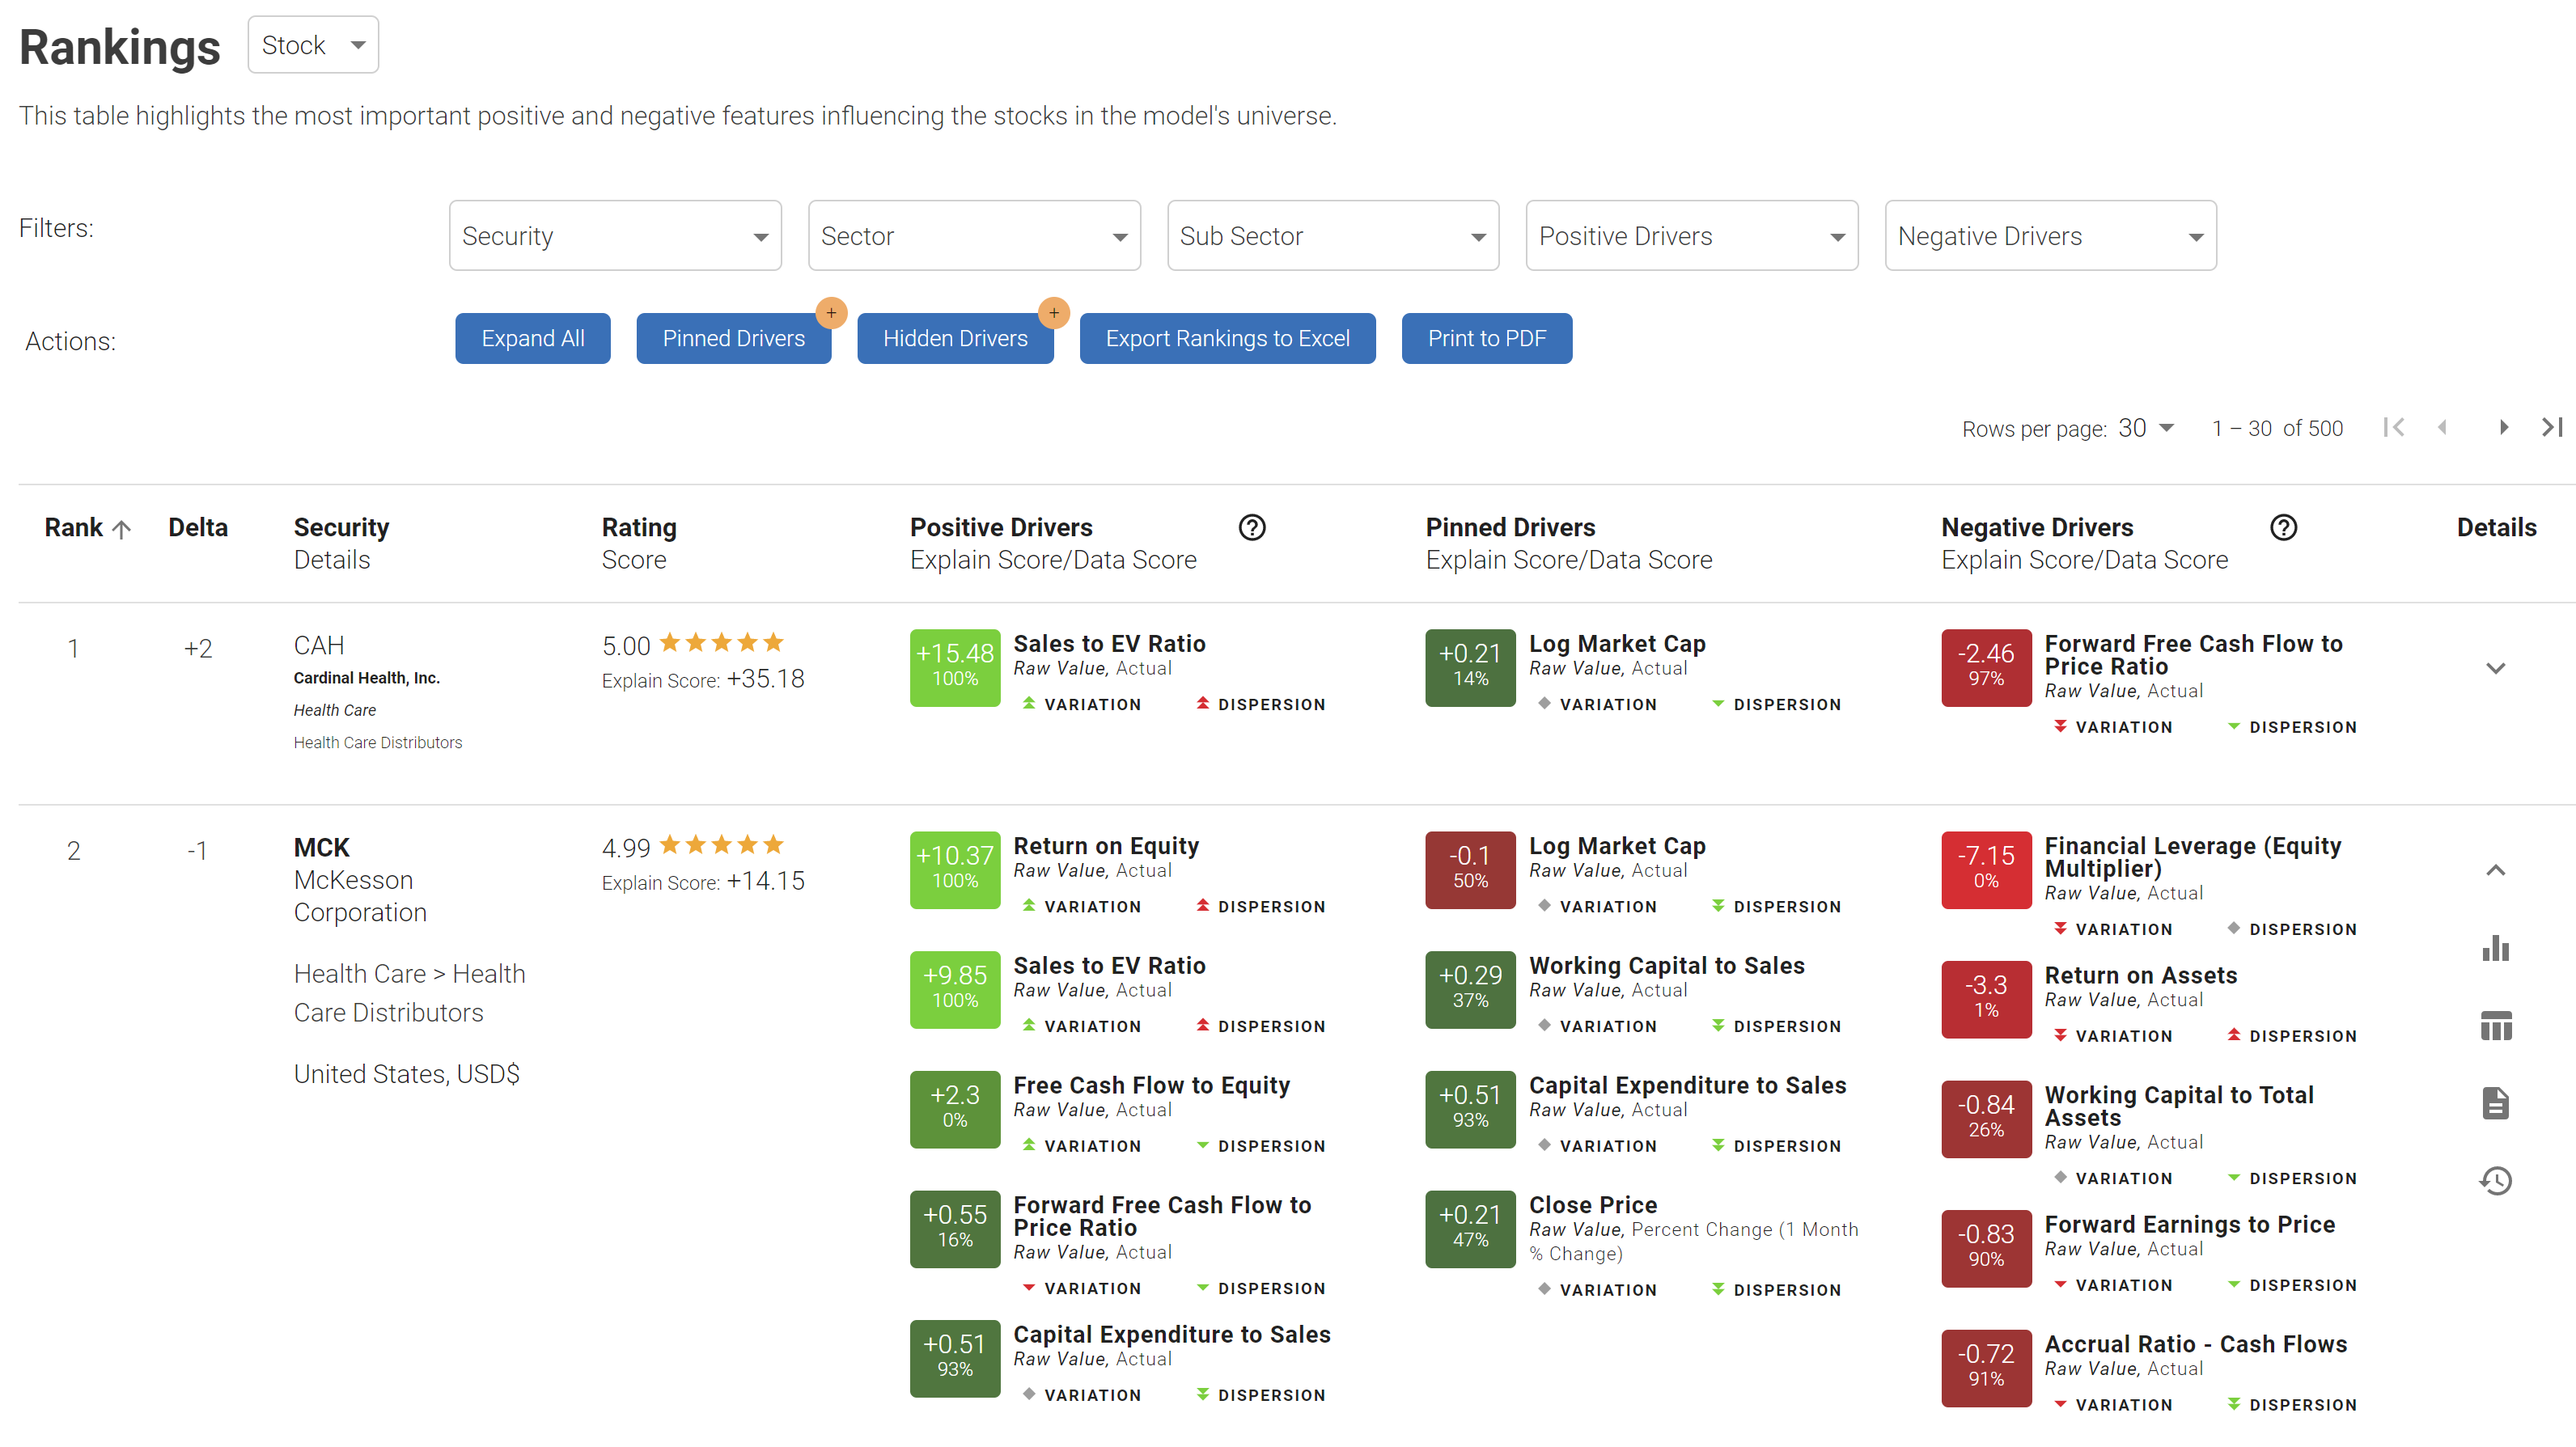
- The Rankings screen surfaces the securities rank, rating and explain score together with its top five positive and negative drivers.
- Using the dropdown next to the heading you also switch to summarized view of Rankings by Sector or Subsector with all same functionality available.
- In addition to the top five positive and negative drivers, the user can delve deeper into an equity's driving features in a more detailed view. The detailed view showcases a direct comparison between any two securities in the user's universe. An expanded view of all positive and negative drivers for each security is accessible from this screen as well.
- You are also able to Pin and Hide the drivers, in order to keep the ones deemed the most important at your fingertips or hide the ones you don't want to see. Access this feature through the "Pinned Drivers" and "Hidden Drivers" buttons. The selections are saved across your team and can be adjusted individually.
- Lastly, a number of filtering and export / print options are available as well.
First Use:
Occasionally the V2 rankings might not be pre-generated for your model. If that is the case you will see the "Generate Rankings v2" button. Once started the process will take 6-12 hours after which the updated Rankings screen will be available.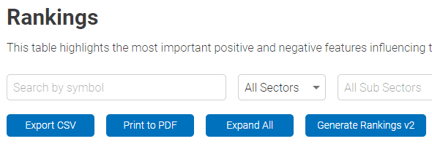
Interpreting Rankings:
Here is an example of how a user can interpret the rankings.
Using MNST, the sample model ranked it a top pick, with +3 change (Delta) in Rank since the previous rebalance. The stock has a 5 star rating and a total Explain Score of +22.31 - this score is the sum of all the individual drivers' explain scores - positive and negative, not just the five shown on screen.

The Explain Score is a linear interpretation of how important the machine thought each driver was for the stock. The individual Explain Scores in most cases will vary from -3 to +3, as a Z-score would (as Z-scores are representative of standard deviations, and few things are more than -3 or +3 standard deviations from the norm), but there is no technical min / max.
Presented below are the Positive & Negative drivers for MNST:
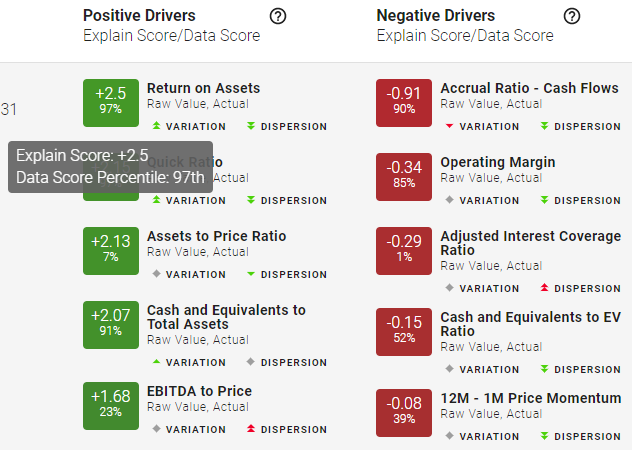
Using Return on Assets as an example - hovering over the titles brings up tooltips
- Drivers: Return on Assets is a positive driver with an explain score of +2.5. That score falls into the 97th percentile of the stock universe. That is, if there are 100 stocks in the universe, the Return on Assets for MNST is better than 97 stocks.
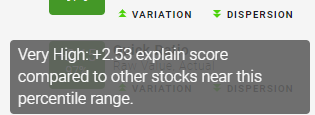
- Variation is Very High. We break up the stocks into quantiles, so since MNST is in the 97th percentile we compare it to other stocks in the top quantile (80th to 100th). We take the mean of the Explain Scores for this driver of the stocks in that quantile. In this case, MNST's Explain Score is +2.53 higher than the mean, so it is a positive outlier.
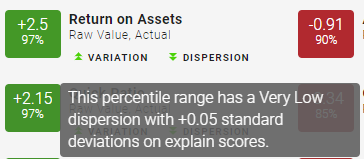
- Dispersion is Very Low. Similar to above, we are measuring the Standard Deviation of the explain scores of this driver of the stocks in the top quantile. In this case the sample is has low dispersion, so MNST score truly is a positive outlier (as compared to if the sample has a very high dispersion then it would not have been clear)
All Securities screen:
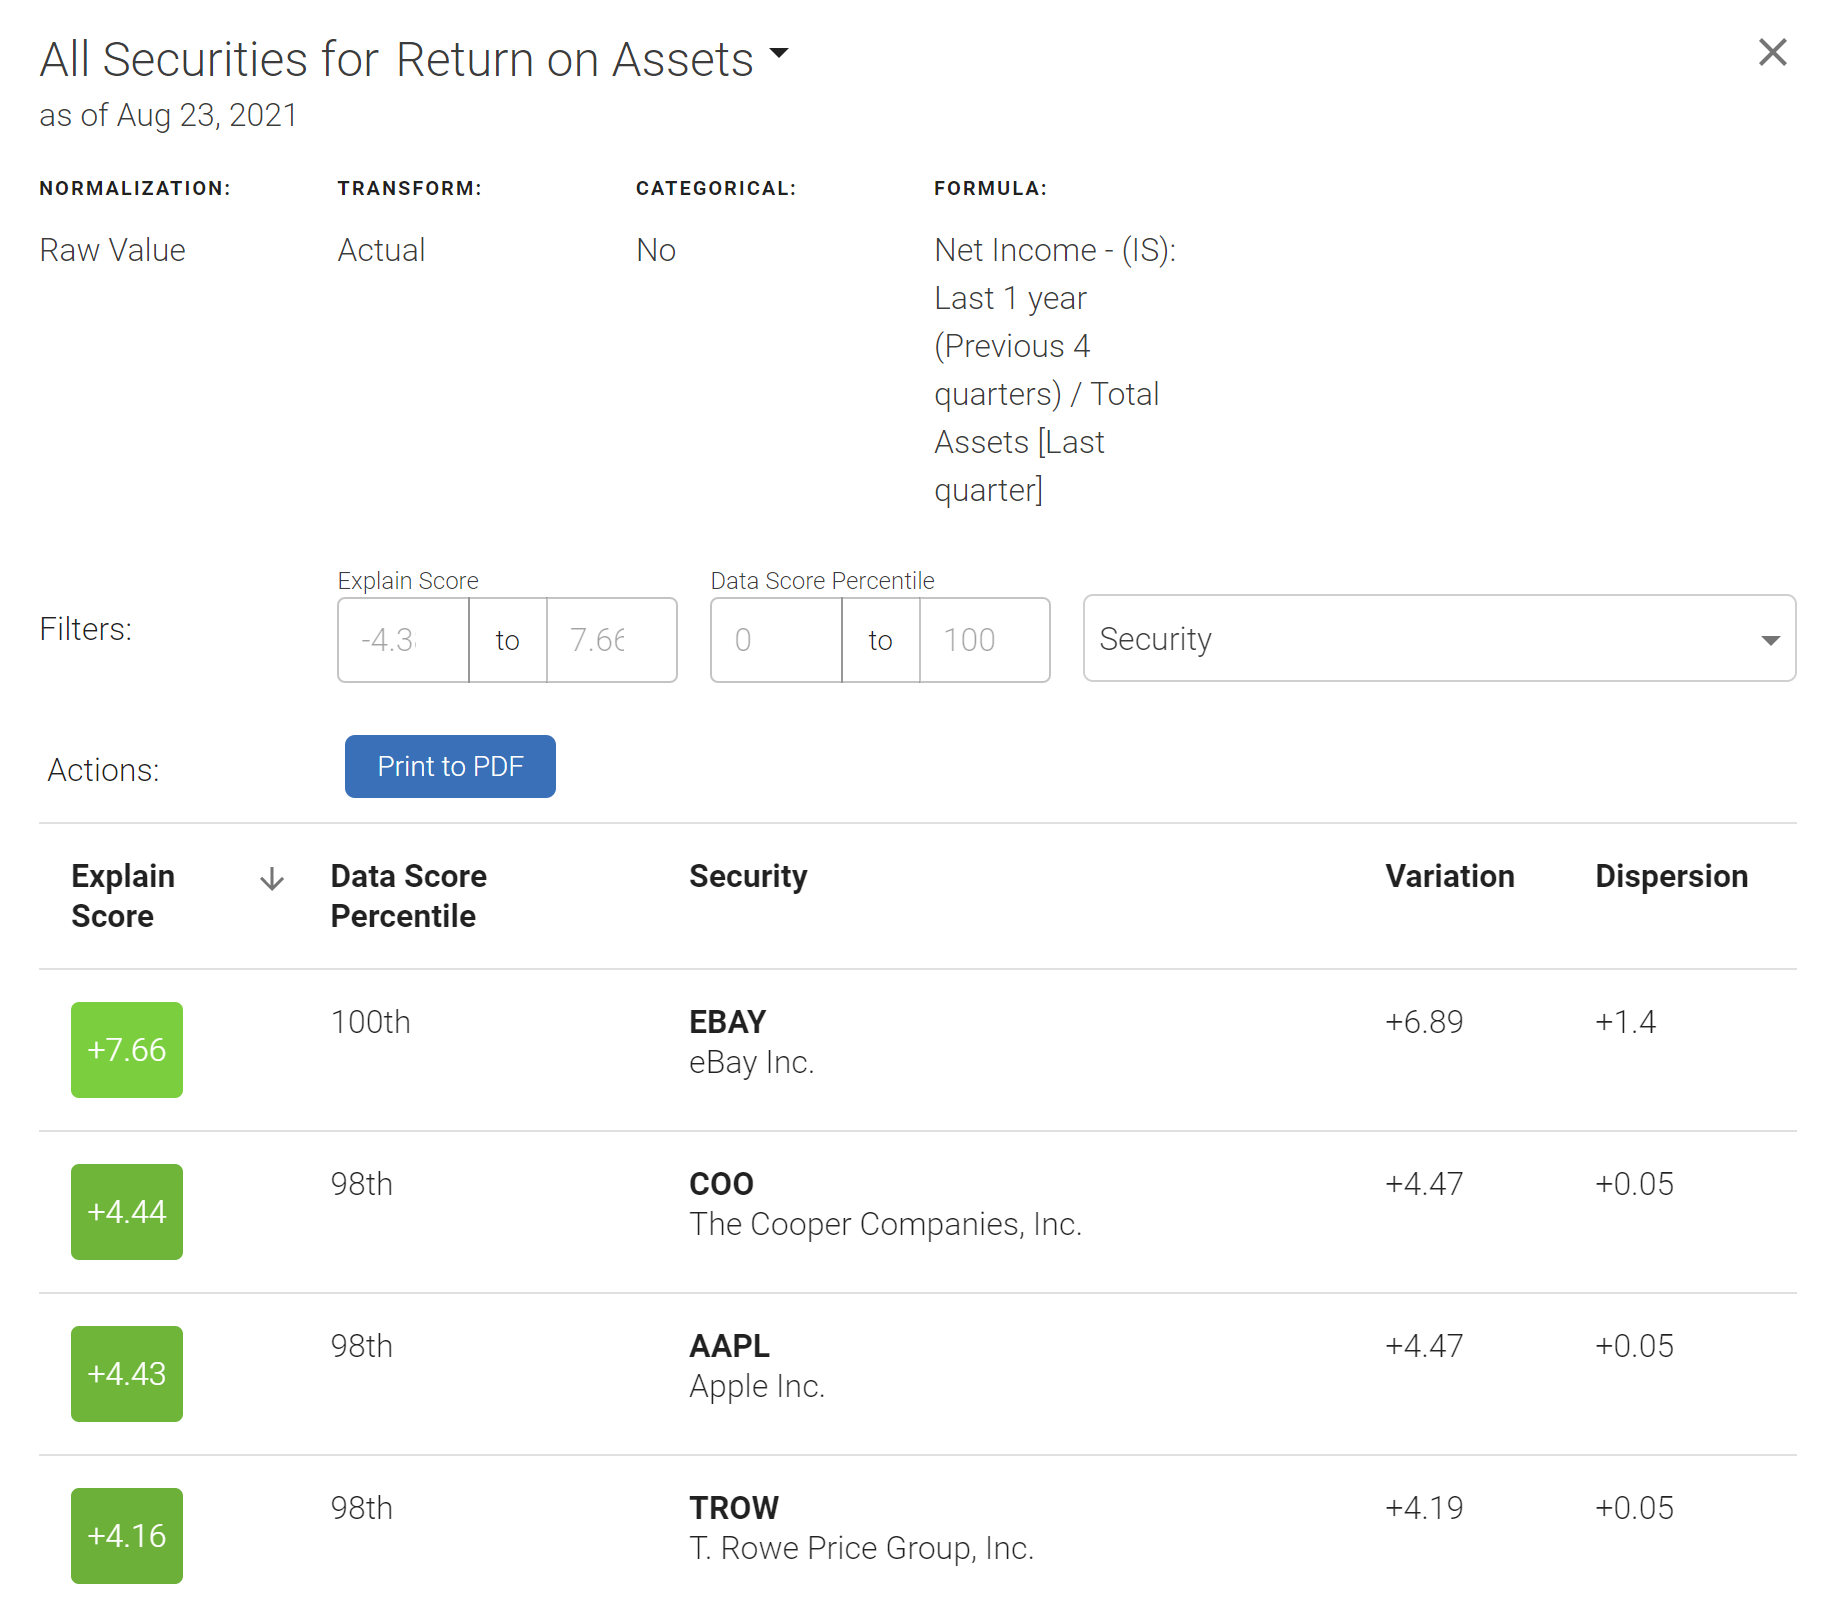
By clicking on the driver itself, you can bring up the screen that will show all securities the selected driver affects. The screen has a variety of filter and sorting options to make research and navigation easier.
All Features screen:
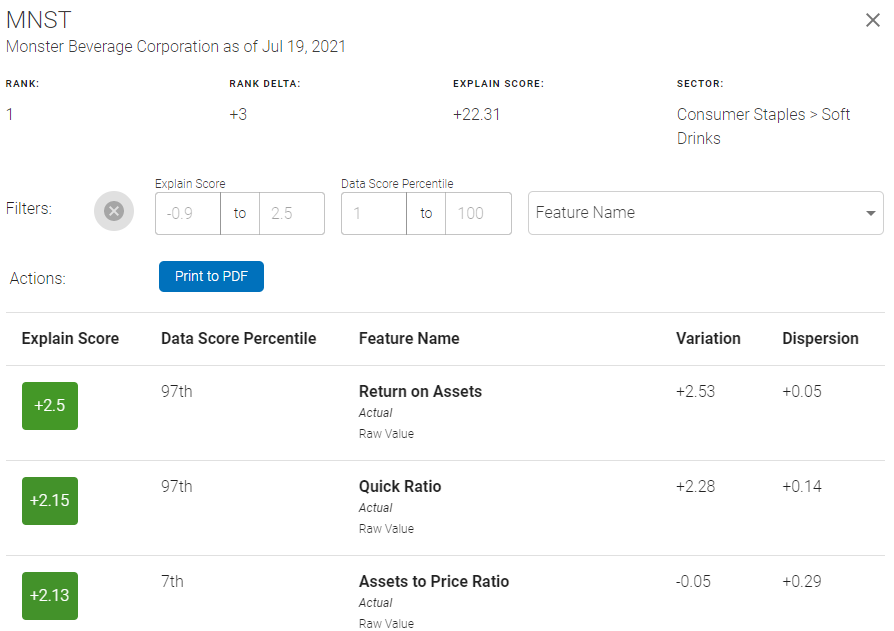
In addition to the Top 5 drivers view, we provide a complete list of all drivers for each stock - as shown in the example below. You can scroll through and filter all the drivers relevant to each stock. The entire list can be exported to PDF for printing.
Security Comparison screen:
Using an example of AMD vs. INTC below, we are able to directly compare securities across the top 5 positive and negative drivers as shown below.
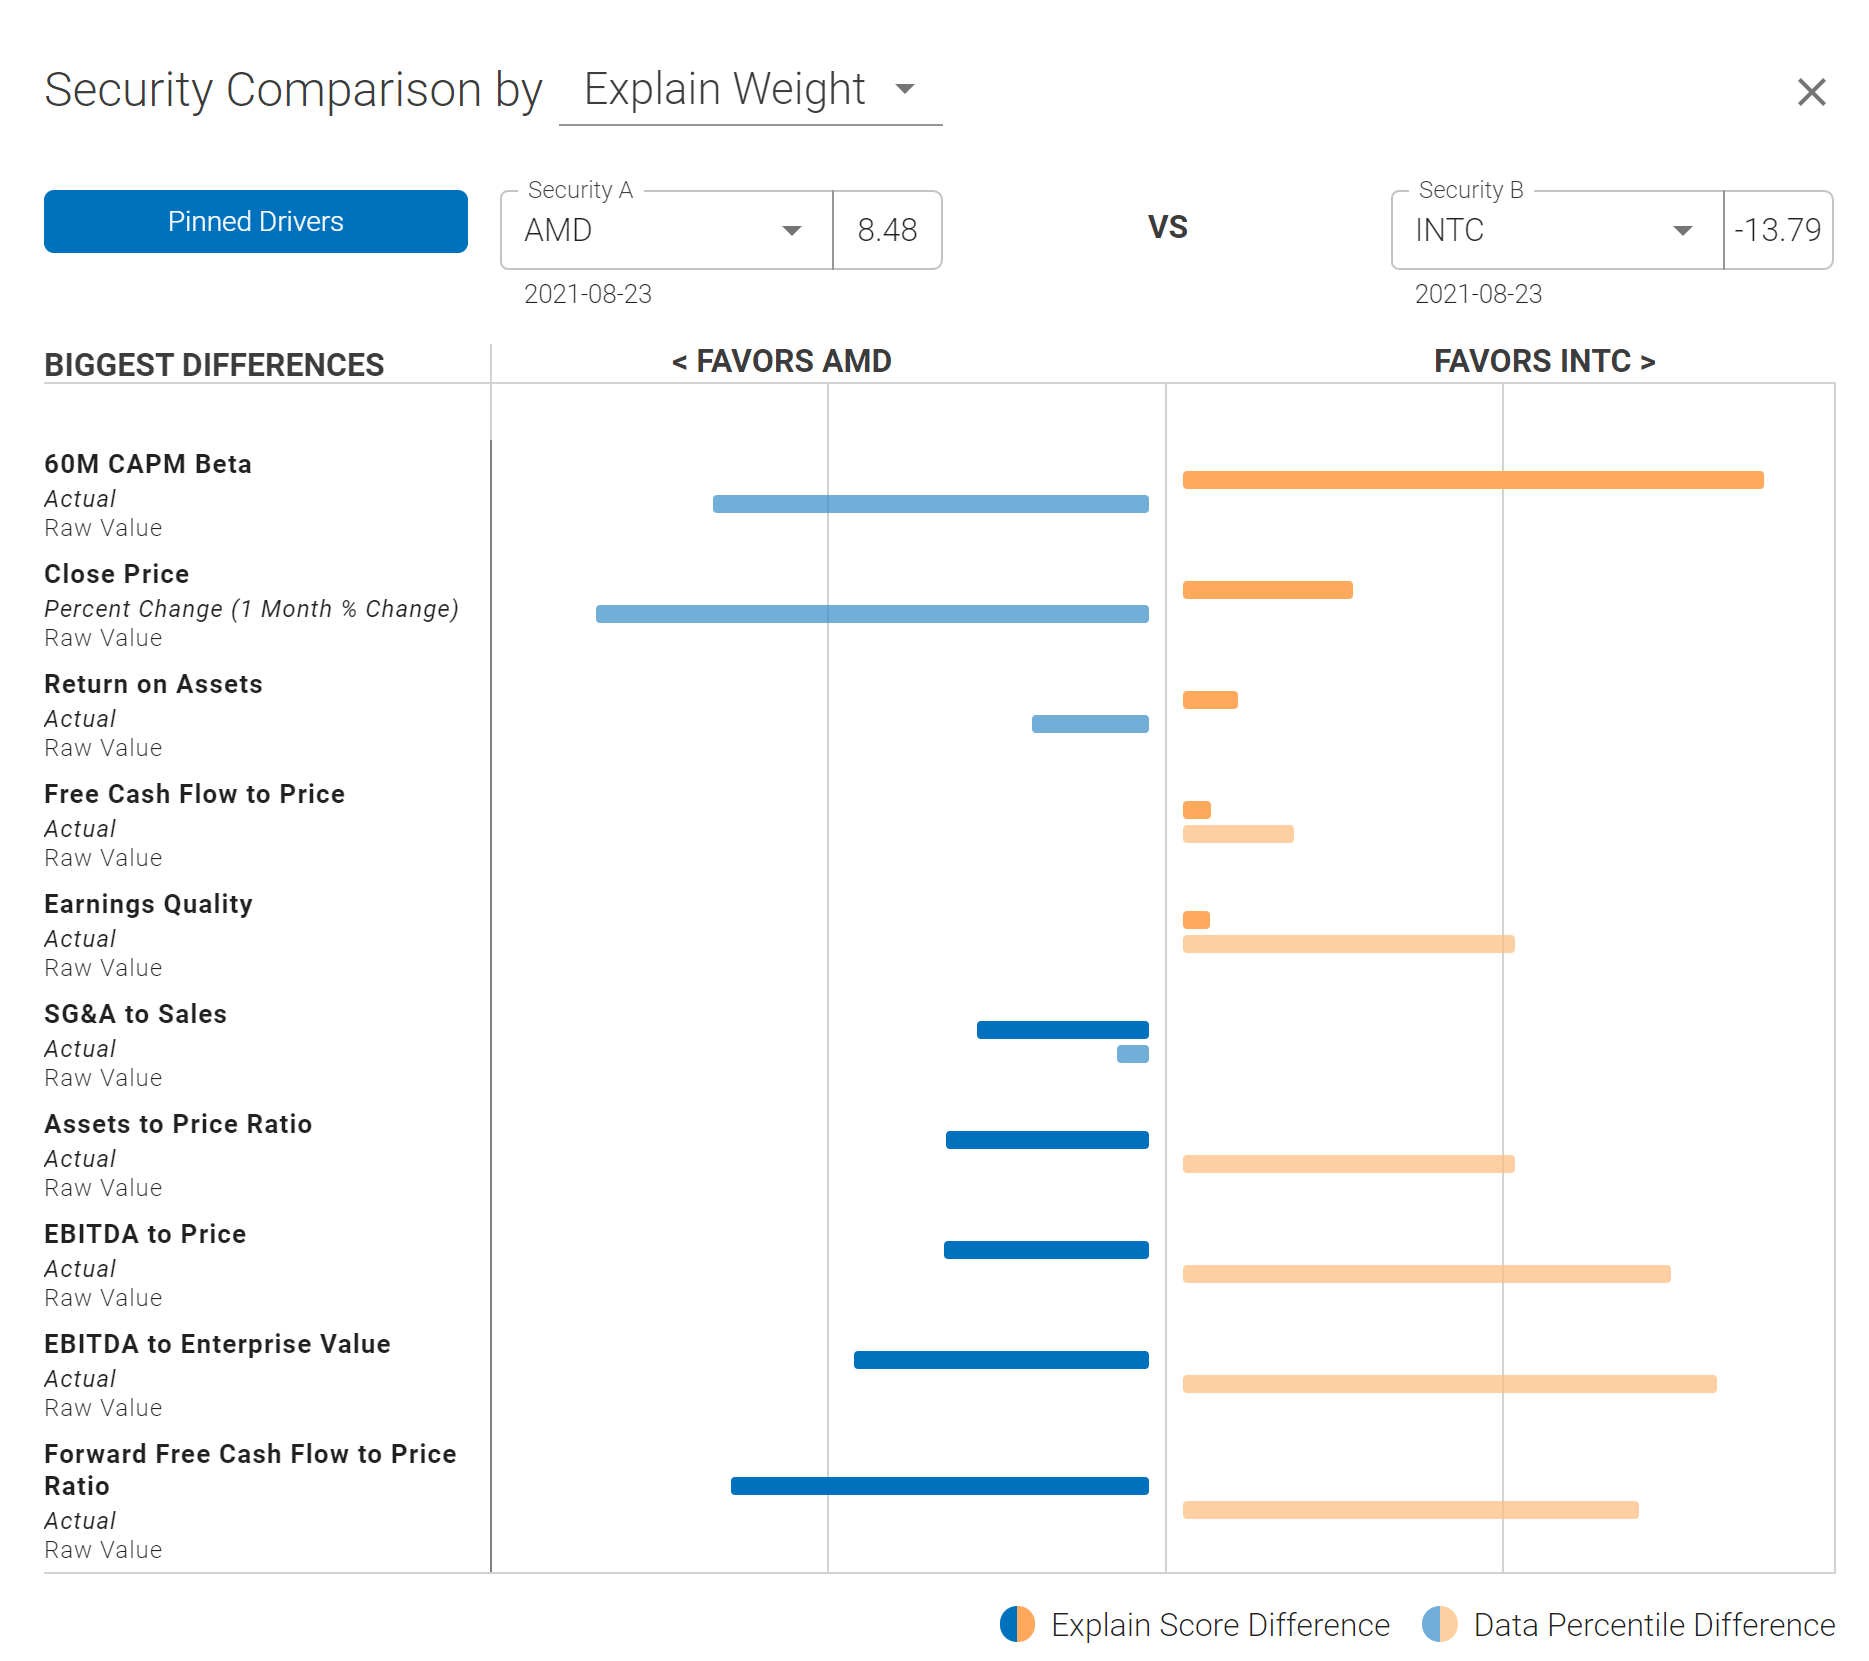 Using 60M CAPM Beta as an example:
- The Explain Score of that driver heavily favors INTC as shown by the dark orange bar
- The Data Percentile of the 60M CAPM Beta explain score is actually higher and favors AMD as shown by the light blue bar
- Even though the Data Percentile of this driver is higher in AMD, the machine still favors INTC given that the actual Explain Score is actually higher
- You can also compare securities or even compare security to itself across different timeframe by selecting a different rebalance day from the calendar dropdown under the ticker filed
- The bars can also be sorted by change in Data Percentile using the dropdown menu in the title
In the same fashion as described above you can also compare single name securities or baskets of stocks to each other or to sectors and sub-sectors.
Trades Screen
Summary of trades for each security is available under the details menu as well.

Filters & Actions:

- Filtering is available to narrow down the output by security / sector or sub sector
- The user can also filter by Positive / Negative drivers across the Universe or subset of securities
- Use Print to PDF to generate a print-formatted ranking list
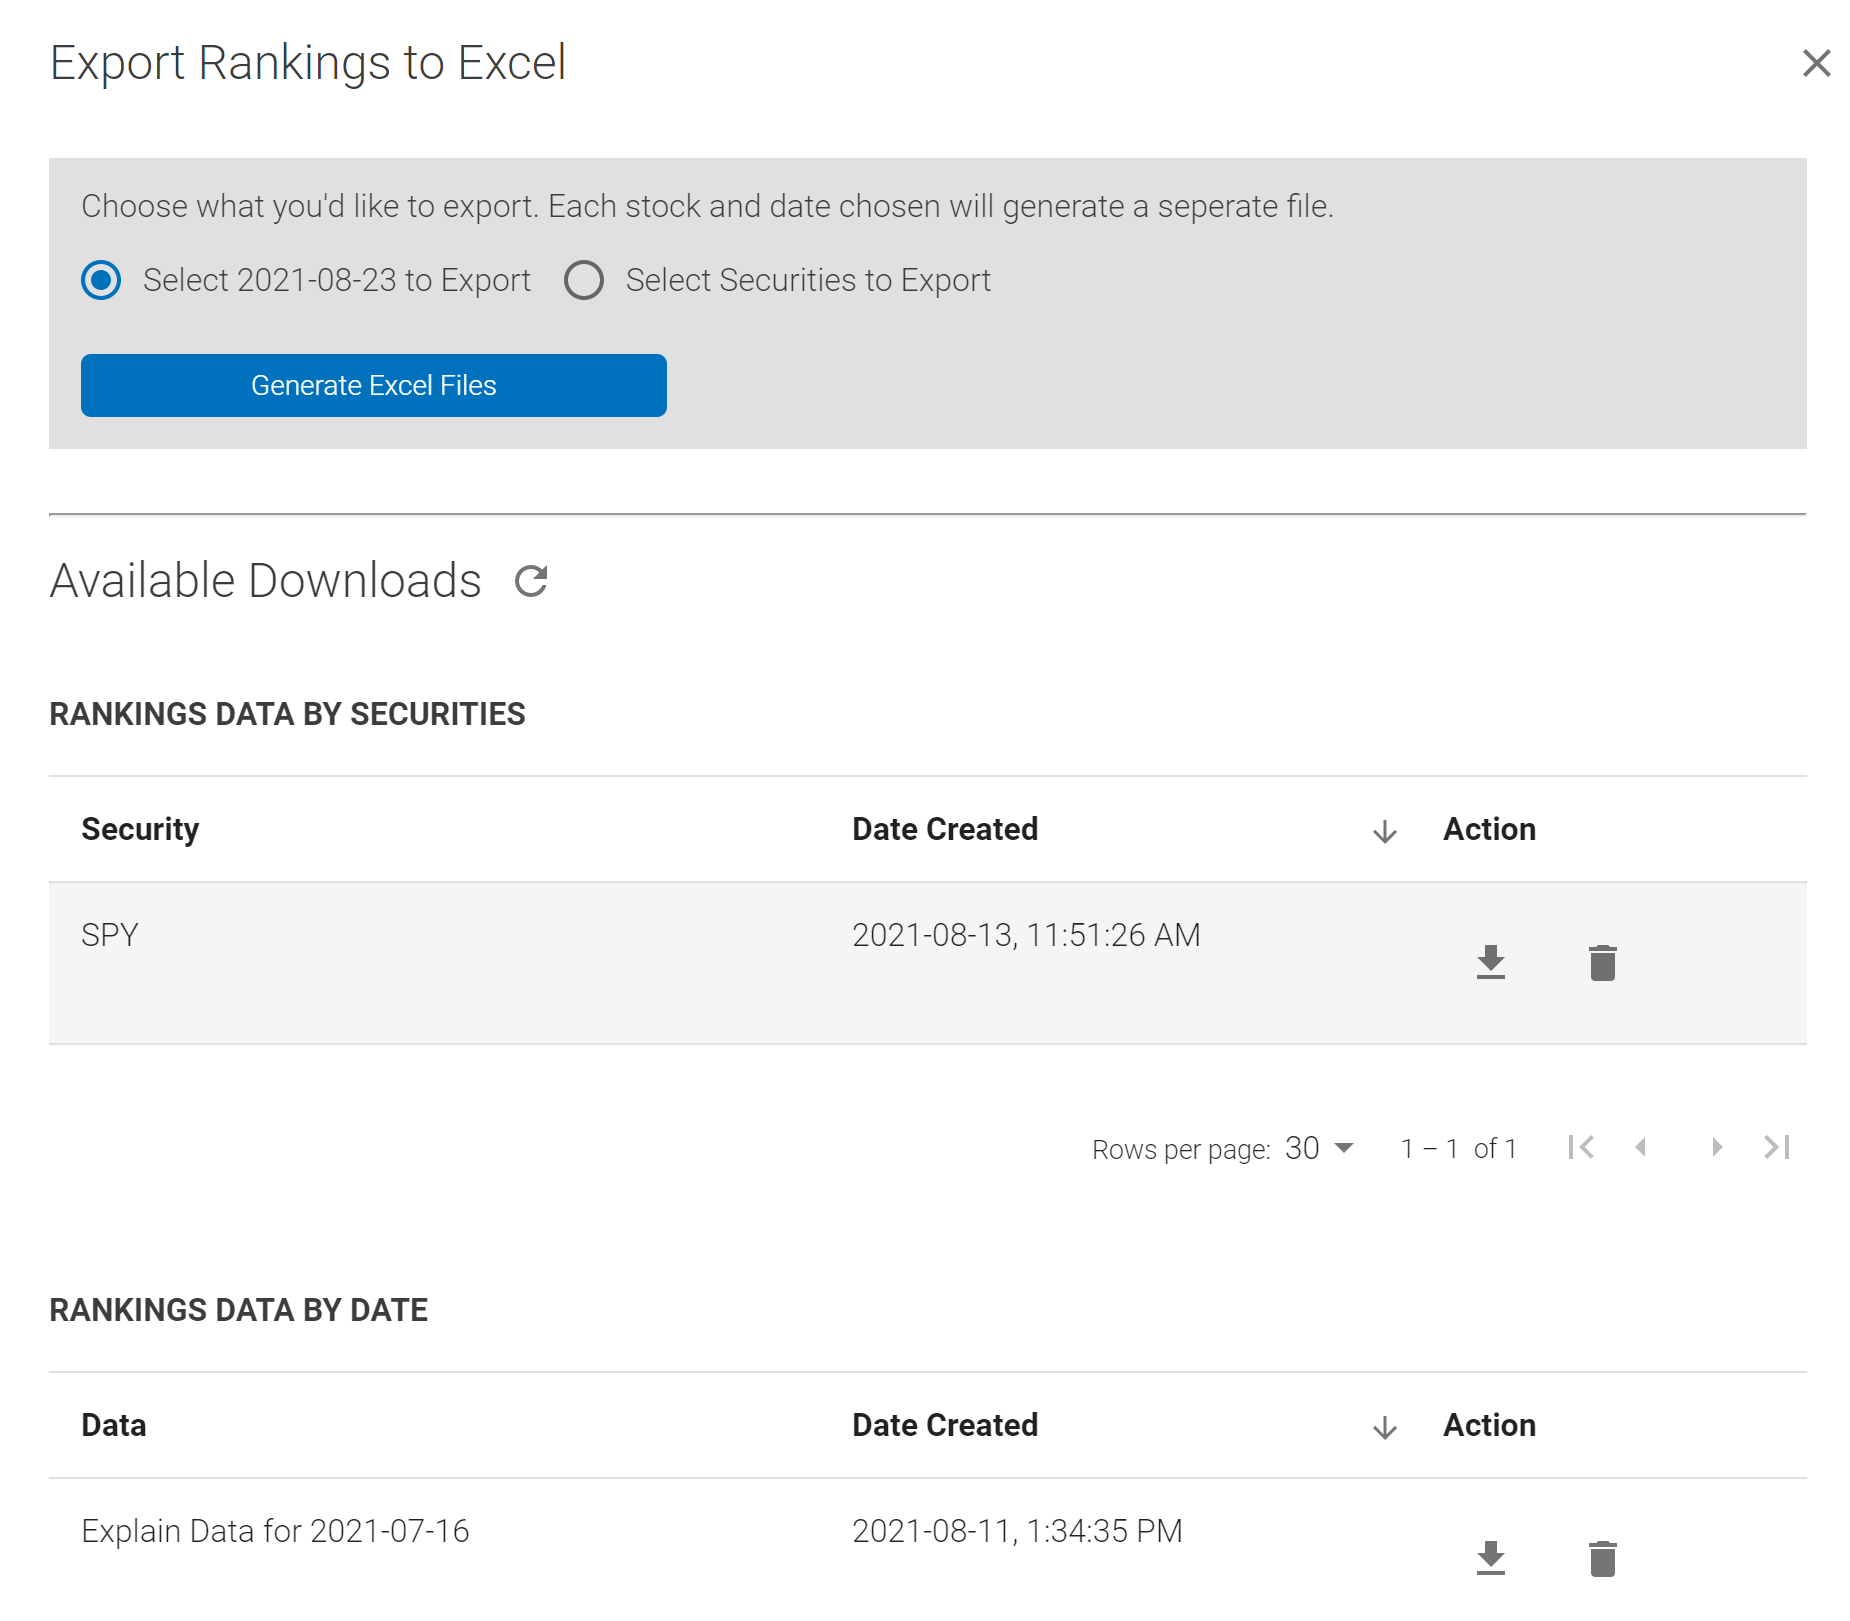
- The Export Rankings to Excel dialogue shown below allows you to select either the overall or security-specific dataset for export. Once the "Generate Excel Files" button is clicked, files will begin generating - use the refresh arrow next to "Available Downloads" to refresh the list. Historical exports are available at the bottom of the screen.
- The date exported is the same as the date selected on the tear sheet. To change the date, change the "Drill Down" date on the model.
