Background:
When building a machine learning driven model, and specifically addressing portfolio allocation and risk management aspects of it, we use statistical techniques to summarize and explain complex market movements and interactions through smaller, more compact factors. The resulting output of this analysis identifies which stocks move together depending on stock market dynamics and groups the results under Machine Learned Factors.

Next, to find out what the machine learned factors are we identify Semantic Risk Factors through NLP. We are then able to map the information about distribution of stocks in each factor to a small set of descriptive terms that characterize this factor.
In practice this translates into the three outputs below:
Risk Groups:
We are able to identify groups of stocks that move together and then further identify how much volatility these groups of stocks account for and which groups move in the opposite directions.

For example - as shown below, Machine 1 indicates that Cruise Lines, Airlines, and Oil & Gas stocks have been moving together, and generally in opposite directions from stocks related to Computing and Medical Devices and Video Games. This factor accounted for 64% of volatility.
A lot of the optimizations are already made automatically to mitigate risk via portfolio allocation given these results, but you can manually set the filters for these factors, and know what you are controlling for.
Discovered Descriptors:
Showcase exactly which securities fall into these groups above. We showcase how much volatility in the stock universe is explained by specific equities, their portfolio exposure and average machine stock rating and its change.

Sectors:
We break down the universe into the classic GICS sectors to showcase their market volatility and corresponding portfolio allocations:
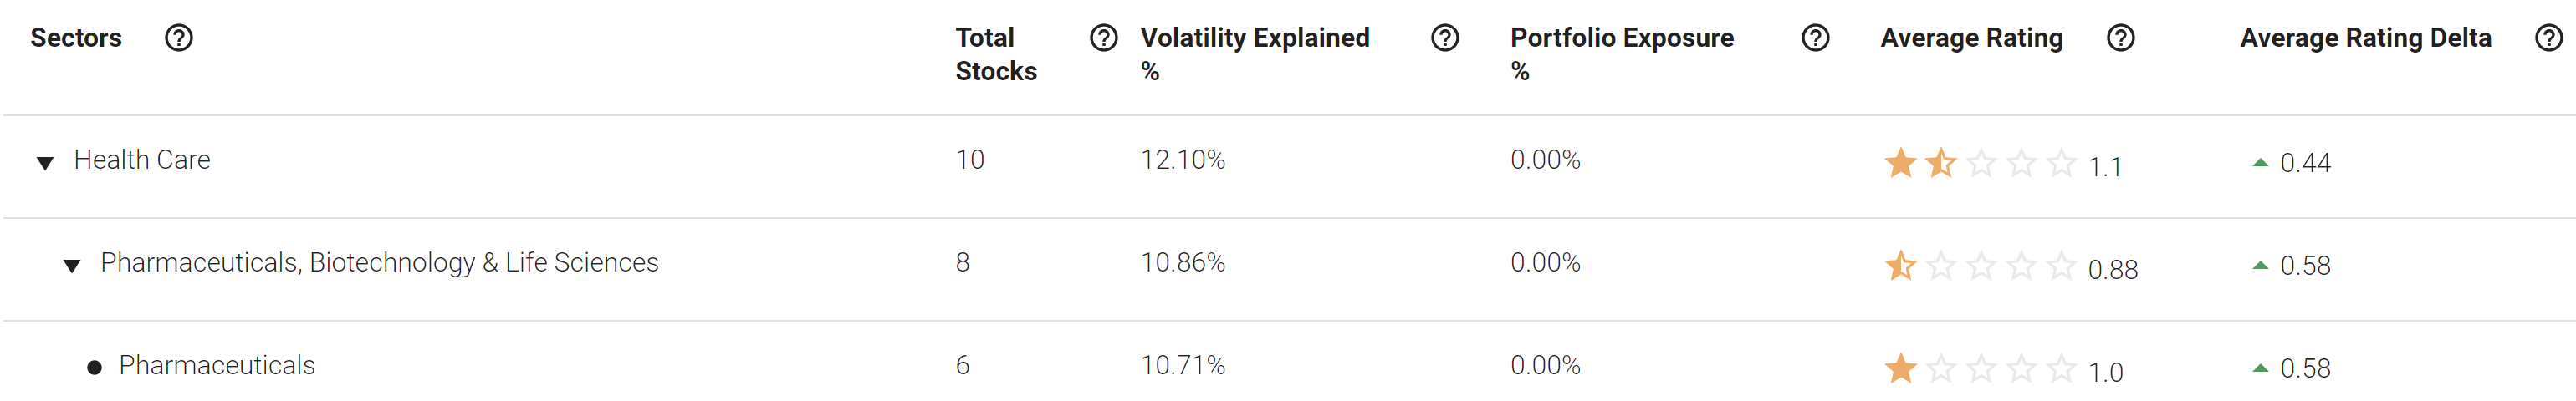
These views allow you to better understand and customize your portfolio and see how the portfolio allocation algorithm has chosen to balance risk and reward given the volatility and star ratings.