A complete guide on using Boosted Insights - Stock Deep-Dive Summary page
With Boosted.ai, you can deep-dive into any stock through the stock’s deep-dive page.
Tip: To get to a stock’s deep-dive page, click on your desired stock from a Watchlist or Portfolio. Alternatively, you can search for it using the Security Search bar at the top of your screen.
Overview
The stock’s deep-dive summary page consists of high-level information surrounding the stock. Specifically, you can find the following:
- The stock’s high-level data
- The stock’s market data
- The stock’s historical price performance
- News Summary
- Themes
- The last quarter’s earnings summary
- Other companies’ earnings that may impact the stock
- Boosted Insights' opinion on the stock
- Strategy analytics for the stock
The stock’s high-level data
At the top of your page, you’ll notice the stock’s high-level data. This gives you a good overview of information on the stock, along with the ability to choose your Consensus option, Delta horizon and Investment horizon.
Tip: This information is available on every page of the stock deep-dive.
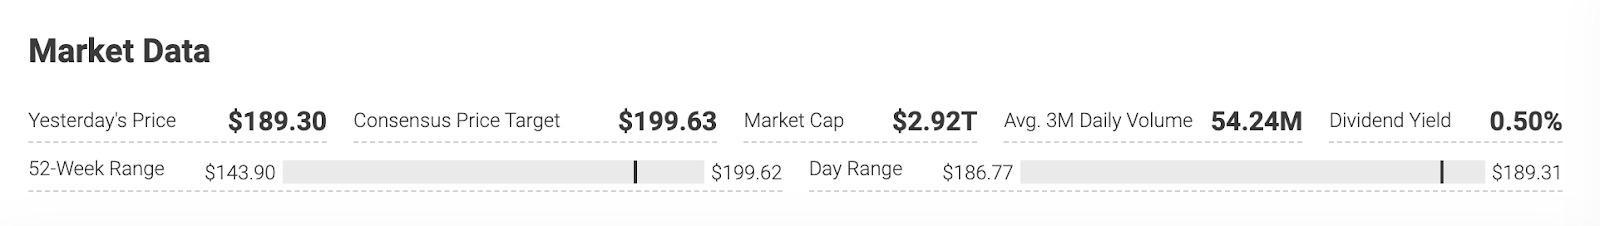
The stock’s market data
In the Market Data section of the Summary page, you’ll see Market Data for your selected stock. We update this information on a daily basis.
The stock’s historical price performance
The Historical Price Performance graph allows you to evaluate how accurate Boosted Insights has been in predicting a stock’s performance. The chart plots the stock’s performance against the benchmark over a 1Y, 3Y, and 5Y time range.
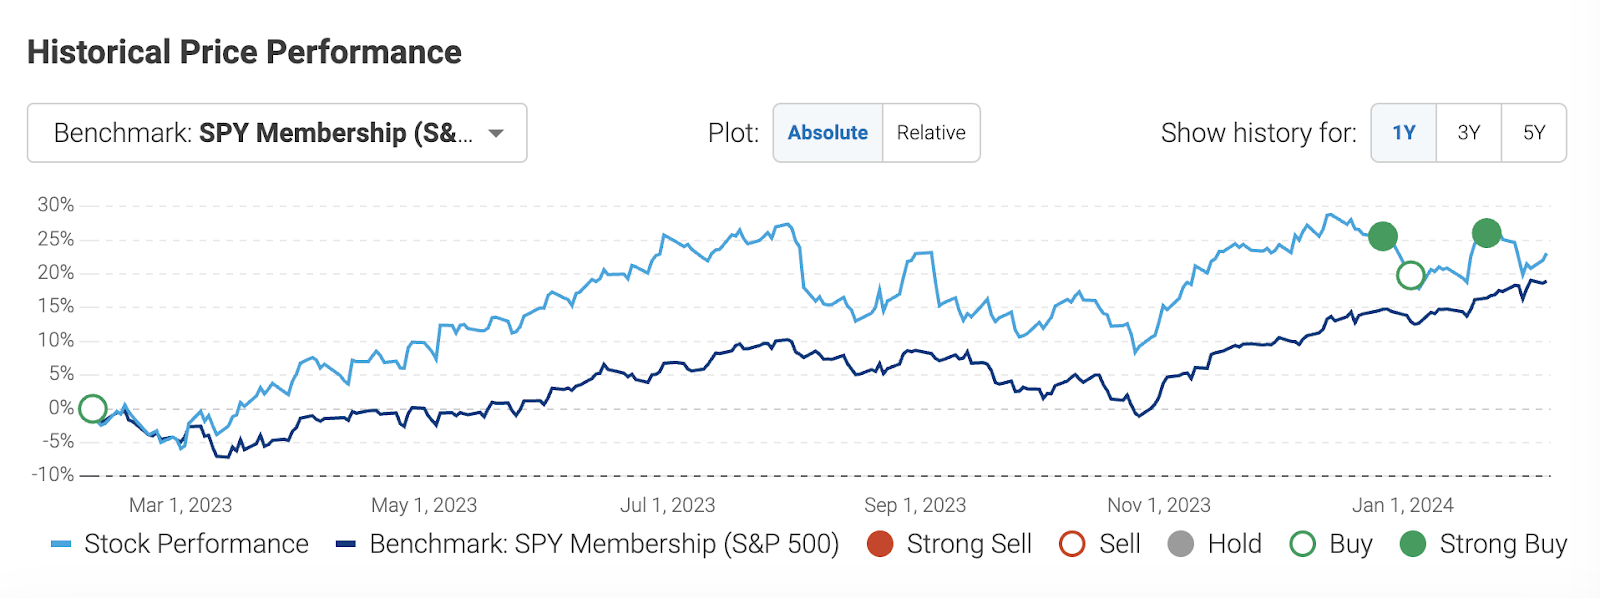
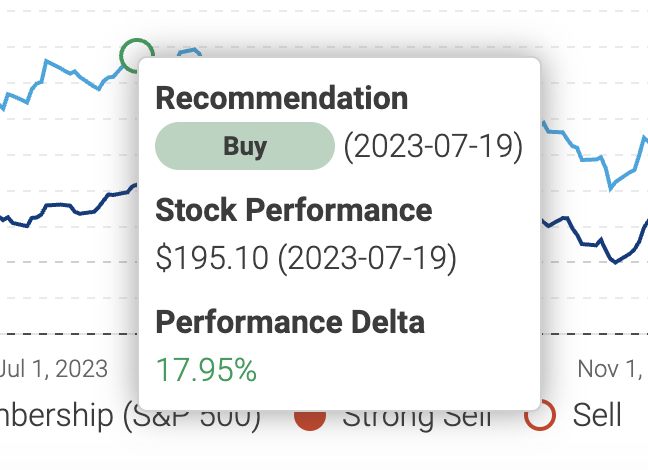
You can hover over any point of the graph to see Boosted Insights’ recommendation at that time.
News Summary
The News Summary widget gives you a glimpse of recent news on the stock.
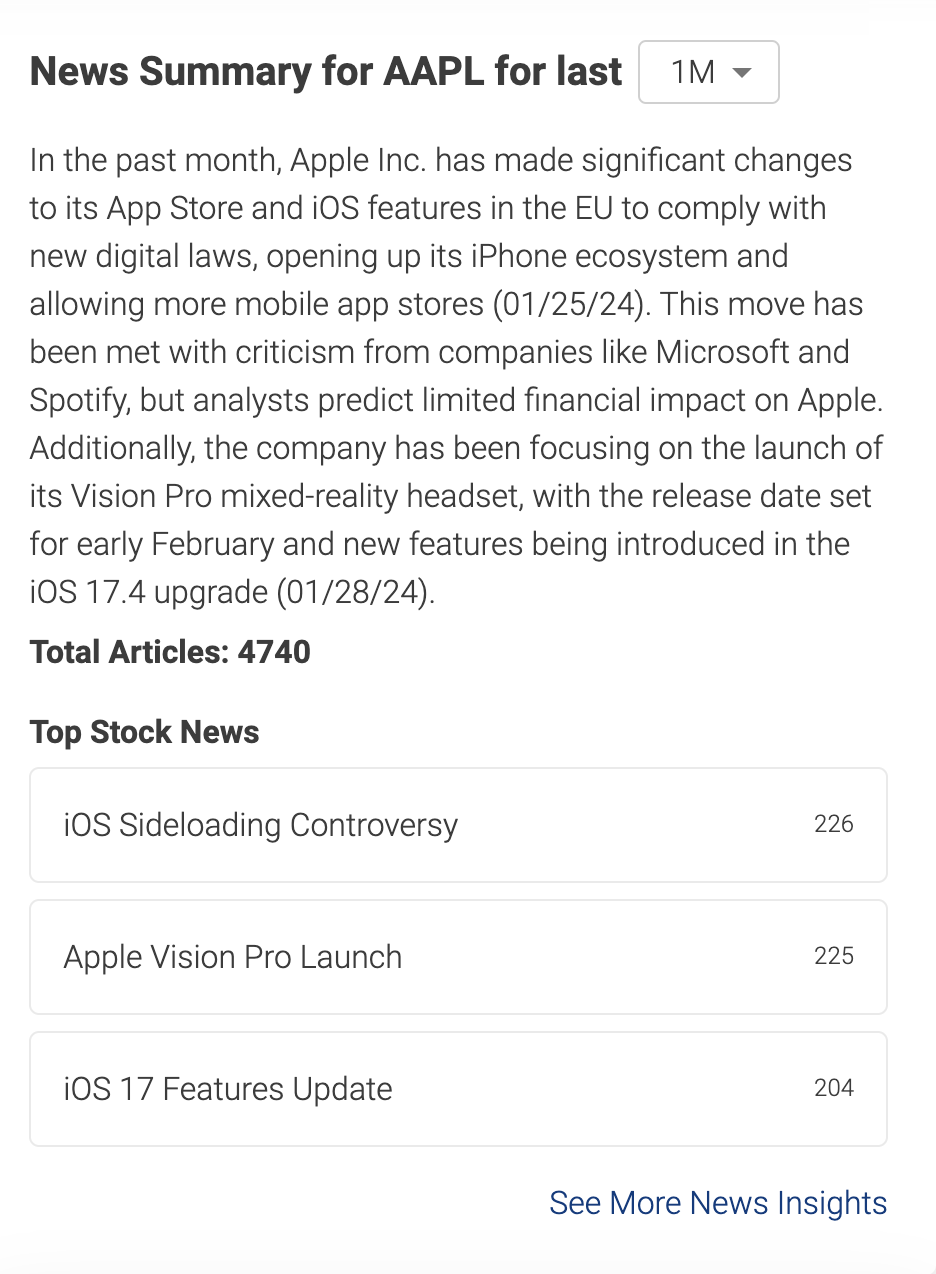
Here, you can see important news surrounding your stock within different timeframes (1D, 1W, 1M). Clicking See More News Insights will take you directly to the News page of the stock deep-dive.
Themes
Themes represent different macro-level trends in the market and come from our Market Trends page. The themes found in the stock deep-dive show you what themes are impacting your stock.
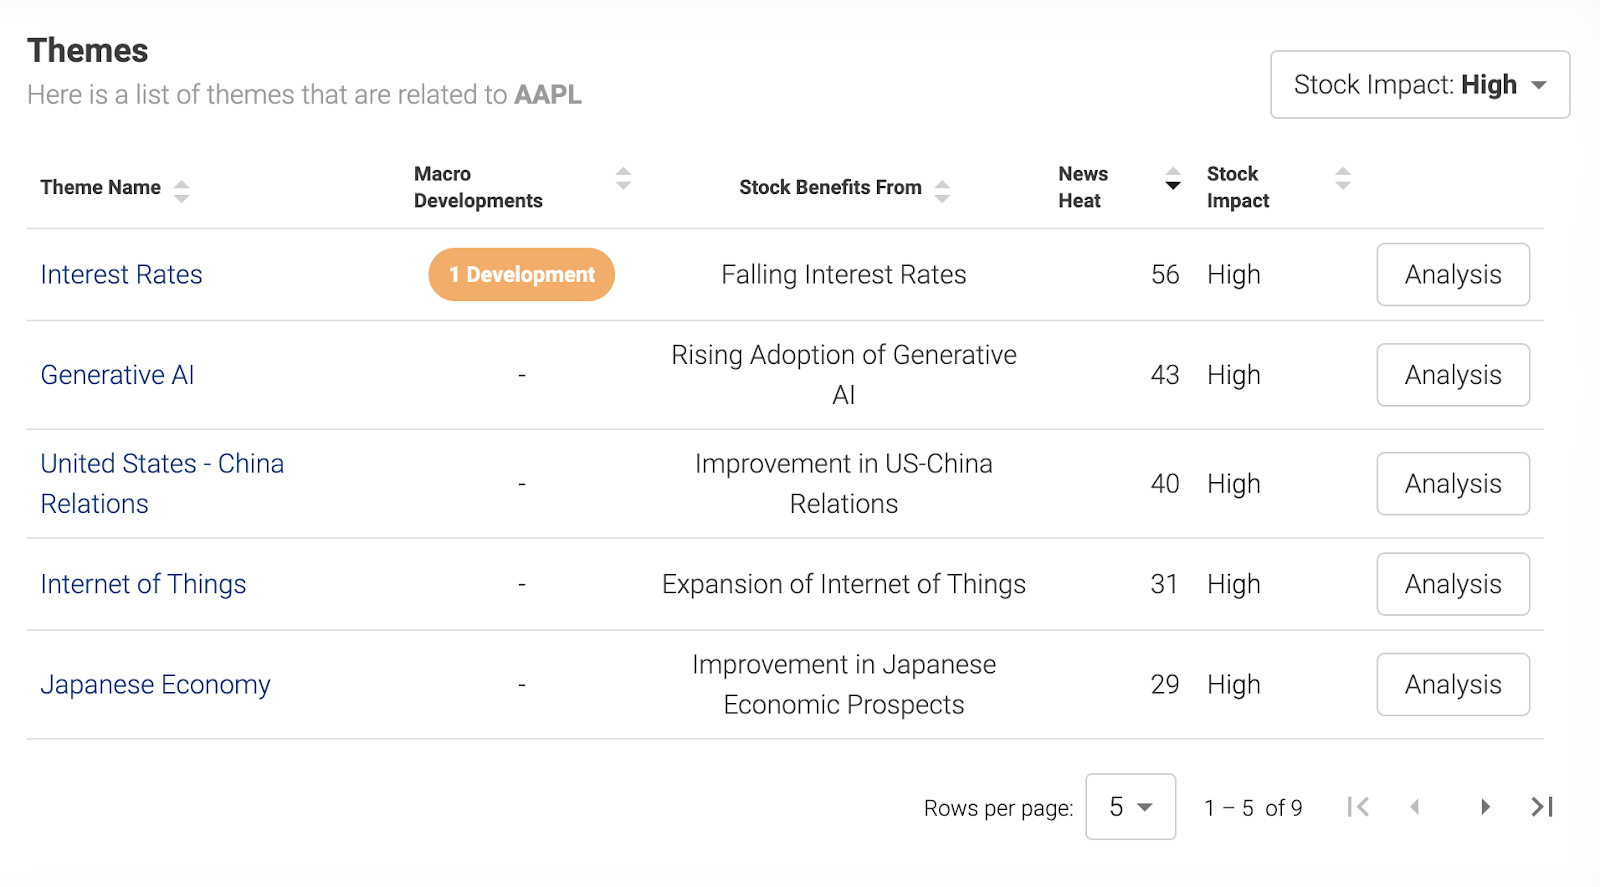
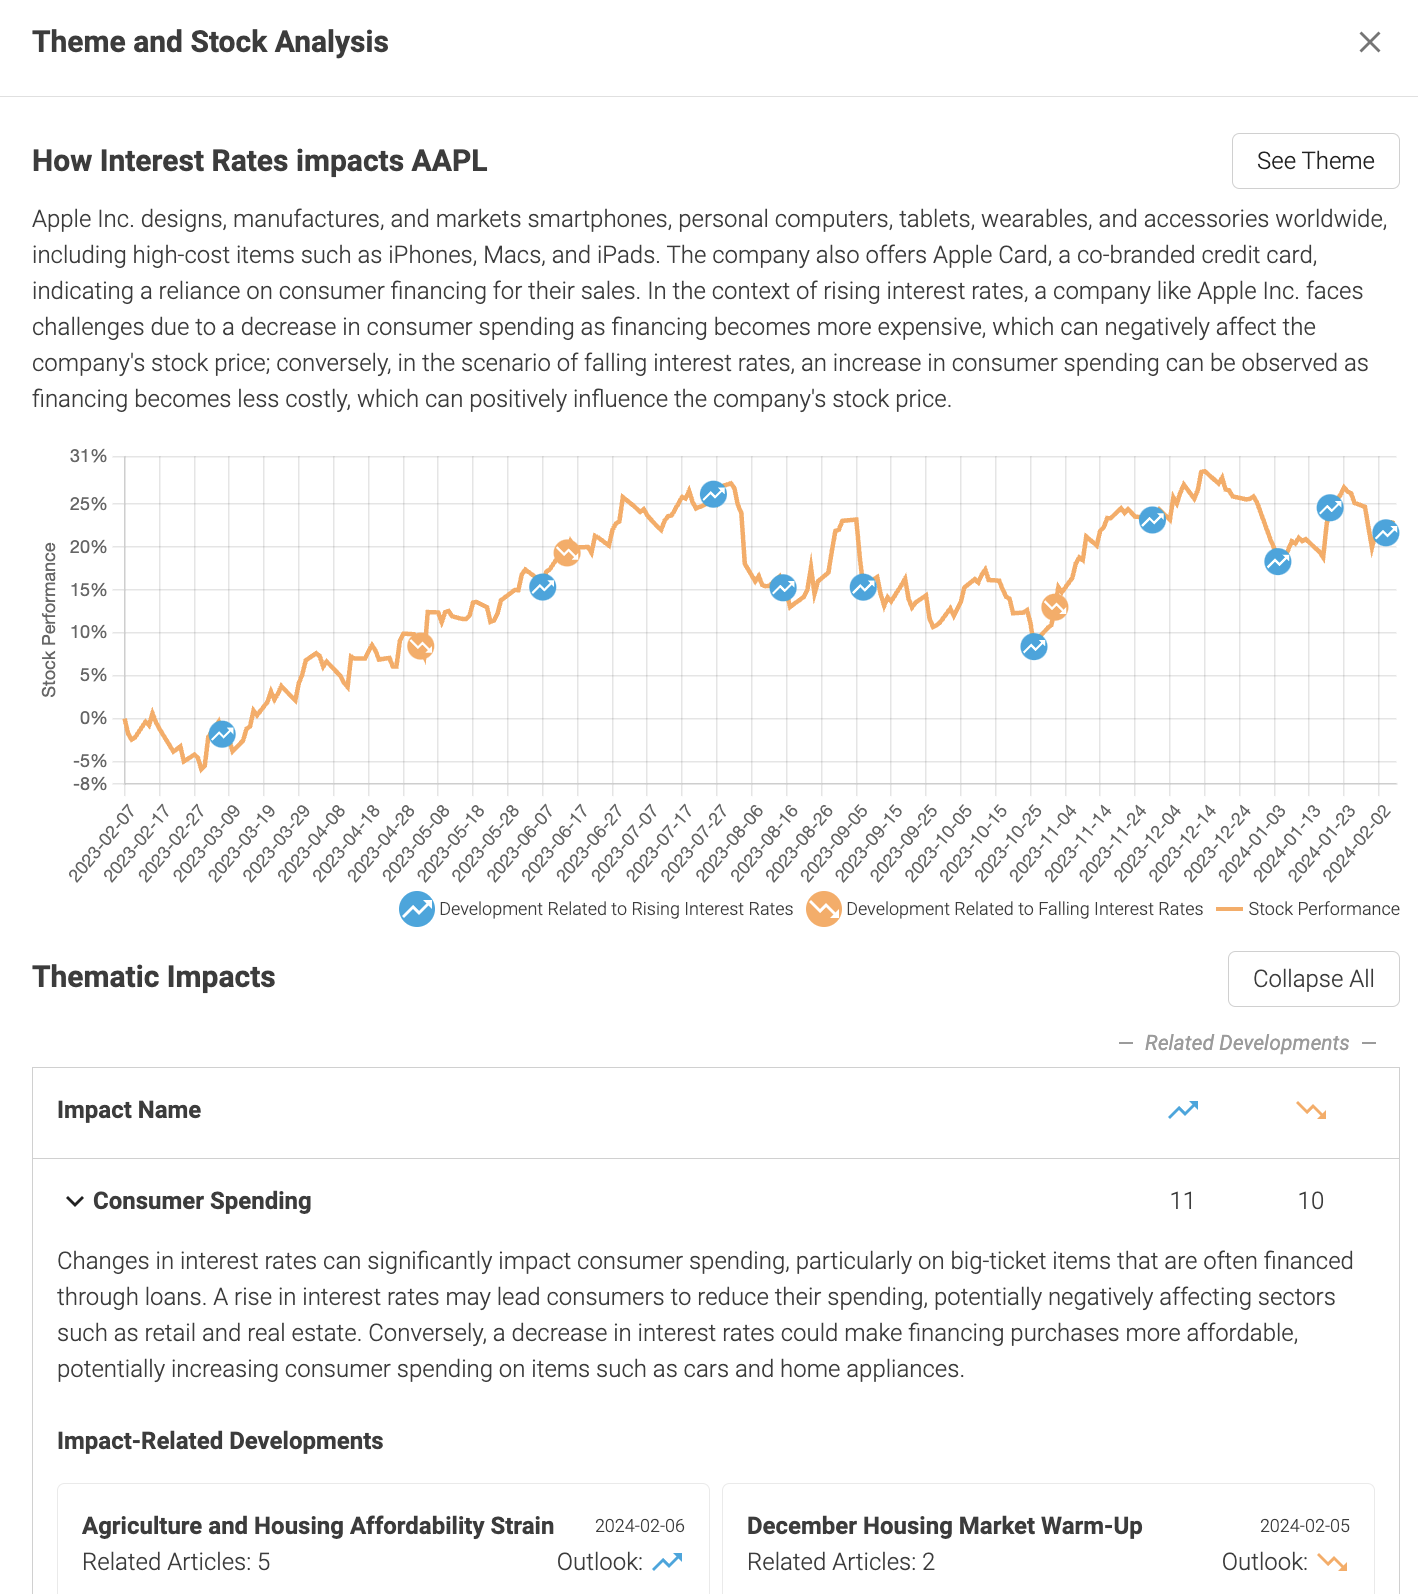
Clicking into the Analysis gives you a more detailed view of how the theme will likely impact the stock.
The last quarter’s earnings summary
Here, we’ll show you a summary of the last earnings call. Specifically, you’ll see key remarks and whether they were positive or negative.
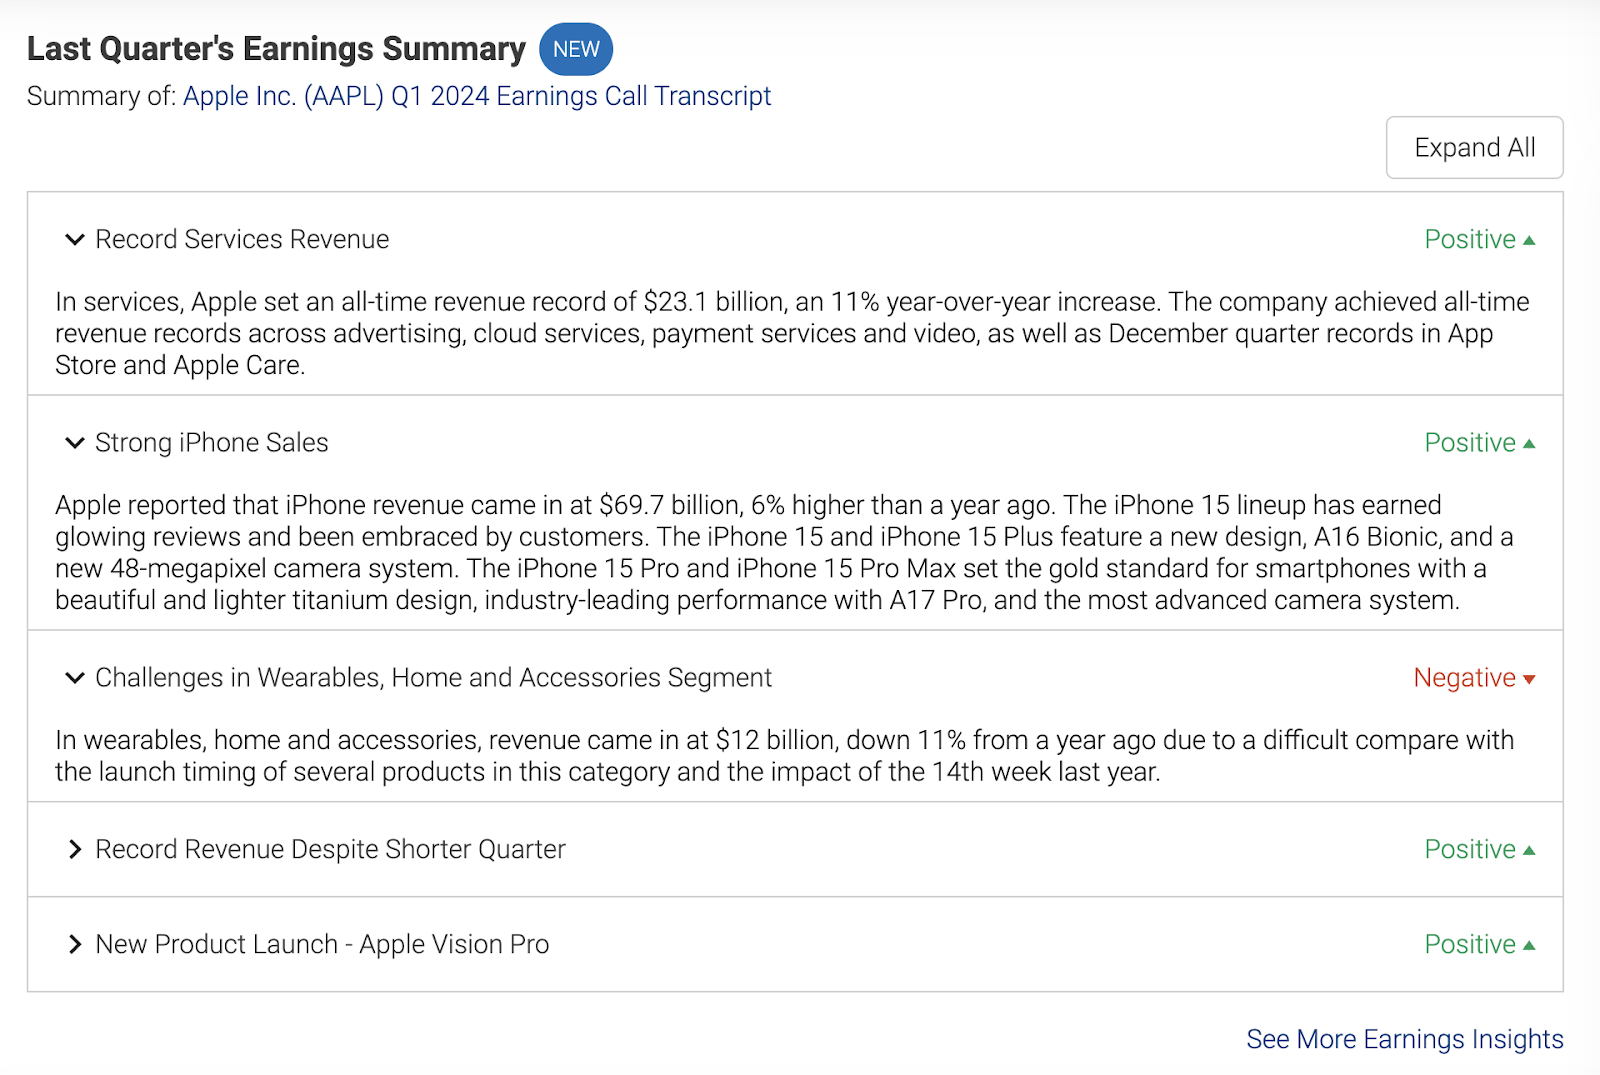
Clicking on See More Earnings Insights will take you to the Earnings page of the stock deep-dive.
Other companies’ earnings that may impact the stock
This table shows you what other companies with upcoming earnings reports will impact your stock.
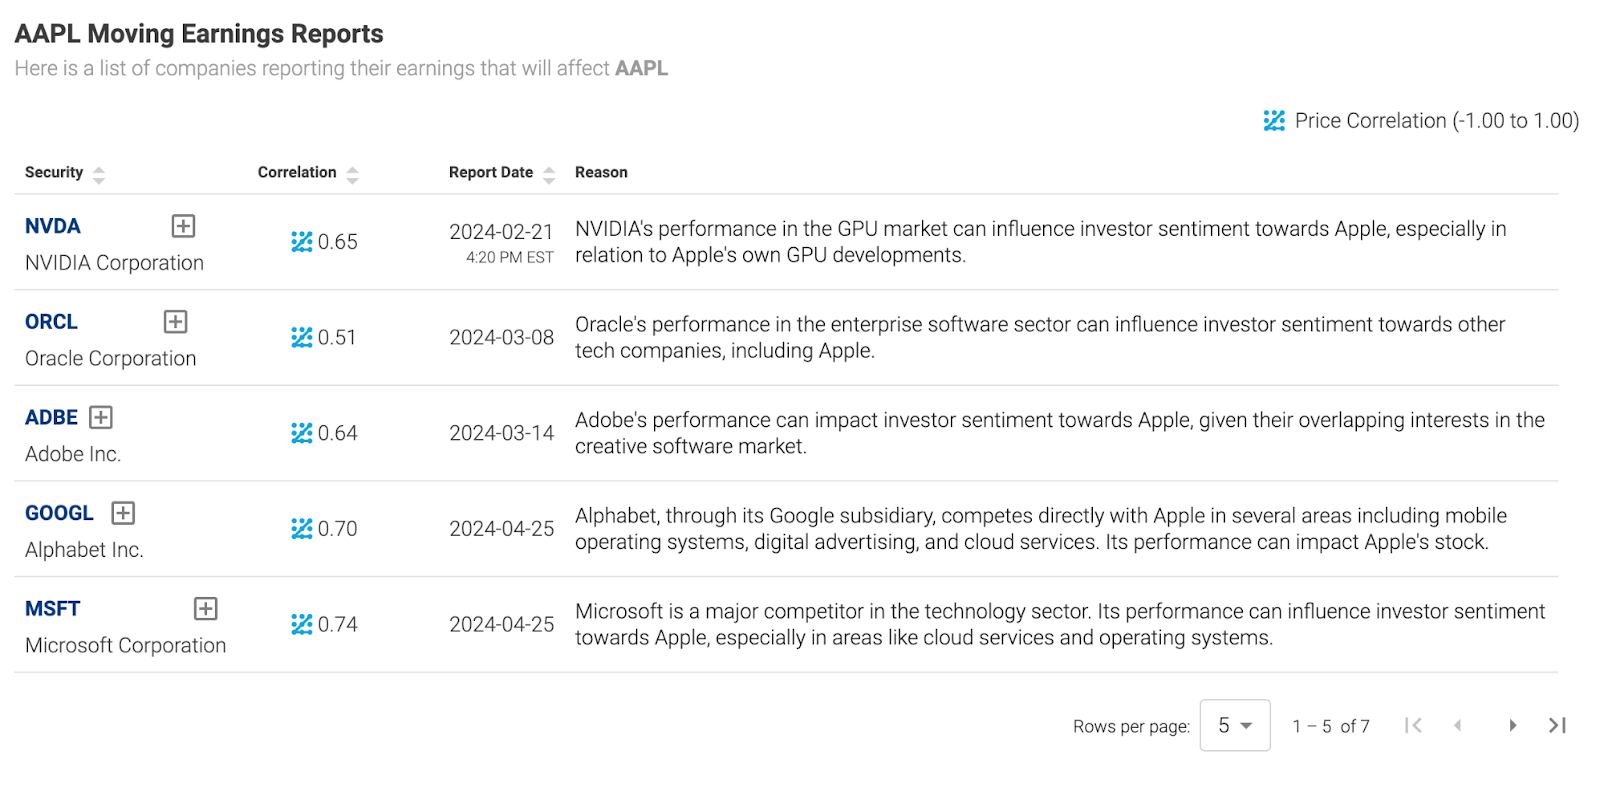
Stocks with higher absolute correlation will move together, therefore it's important to know which stocks trade in the same fashion.
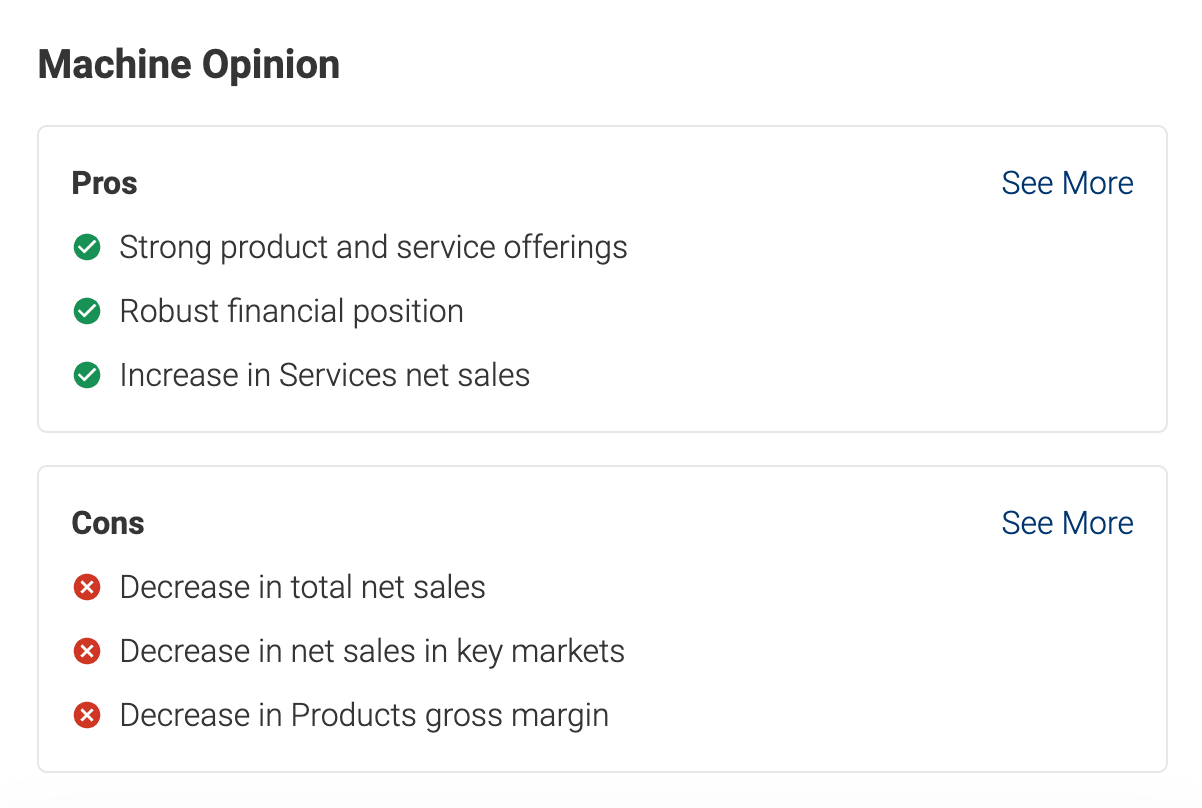
Boosted Insights' opinion on the stock
The Machine Opinion gives you high-level pros and cons on the security, as predicted by Boosted Insights.
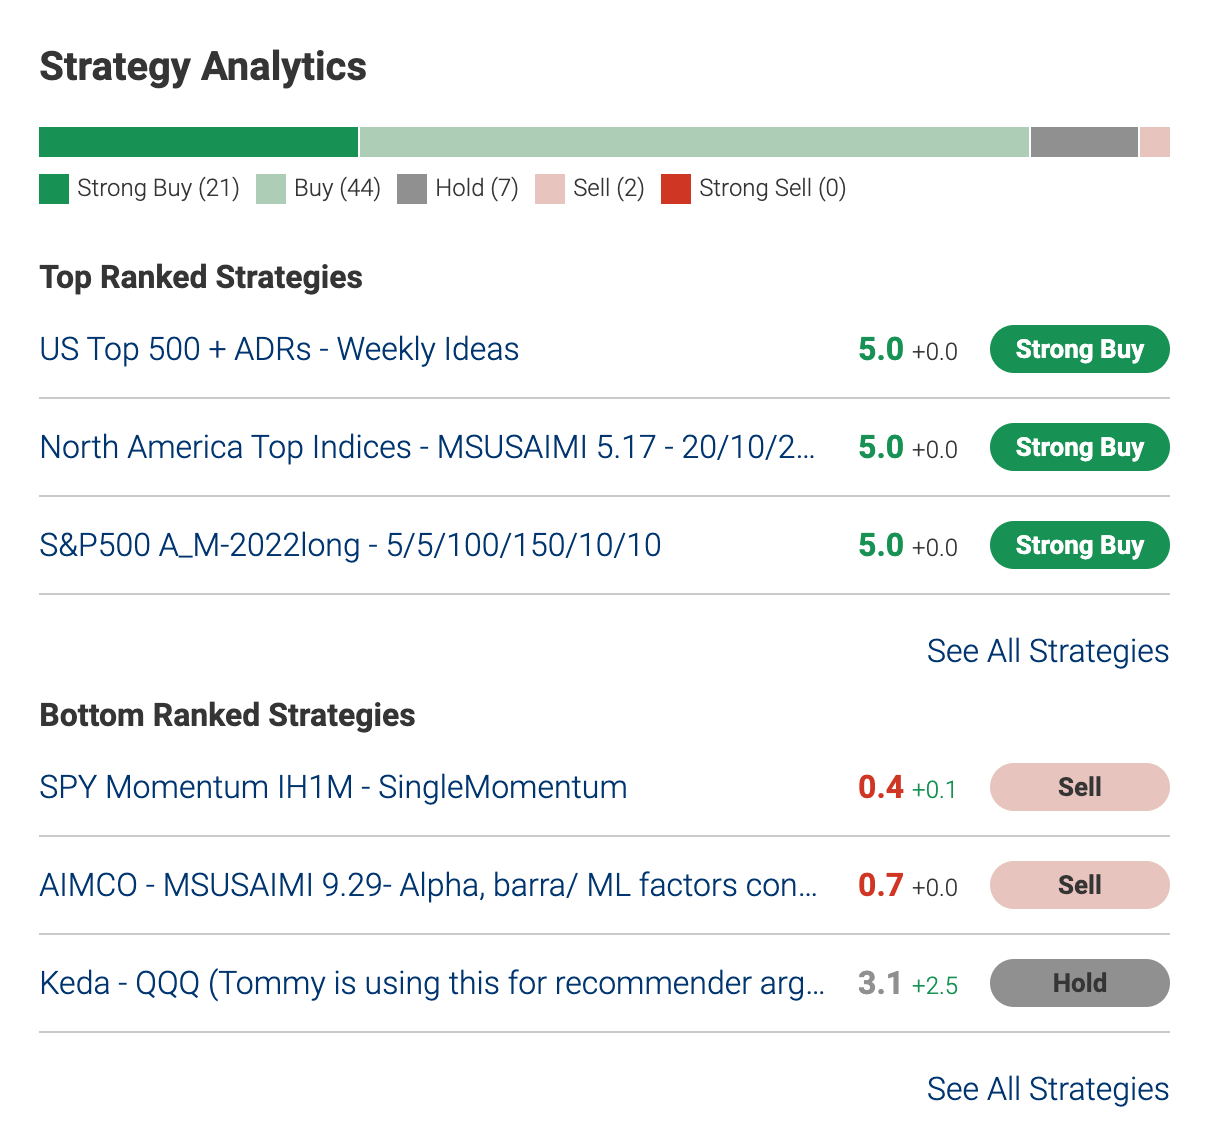
Strategy analytics for the stock
This widget summarizes the Boosted Insights ranking and recommendation across all subscribed strategies. You’ll be able to see the top and bottom ranked strategies at a glance. Alternatively, you can click See All Strategies to deep-dive into Boosted Insights' recommendation across all strategies.