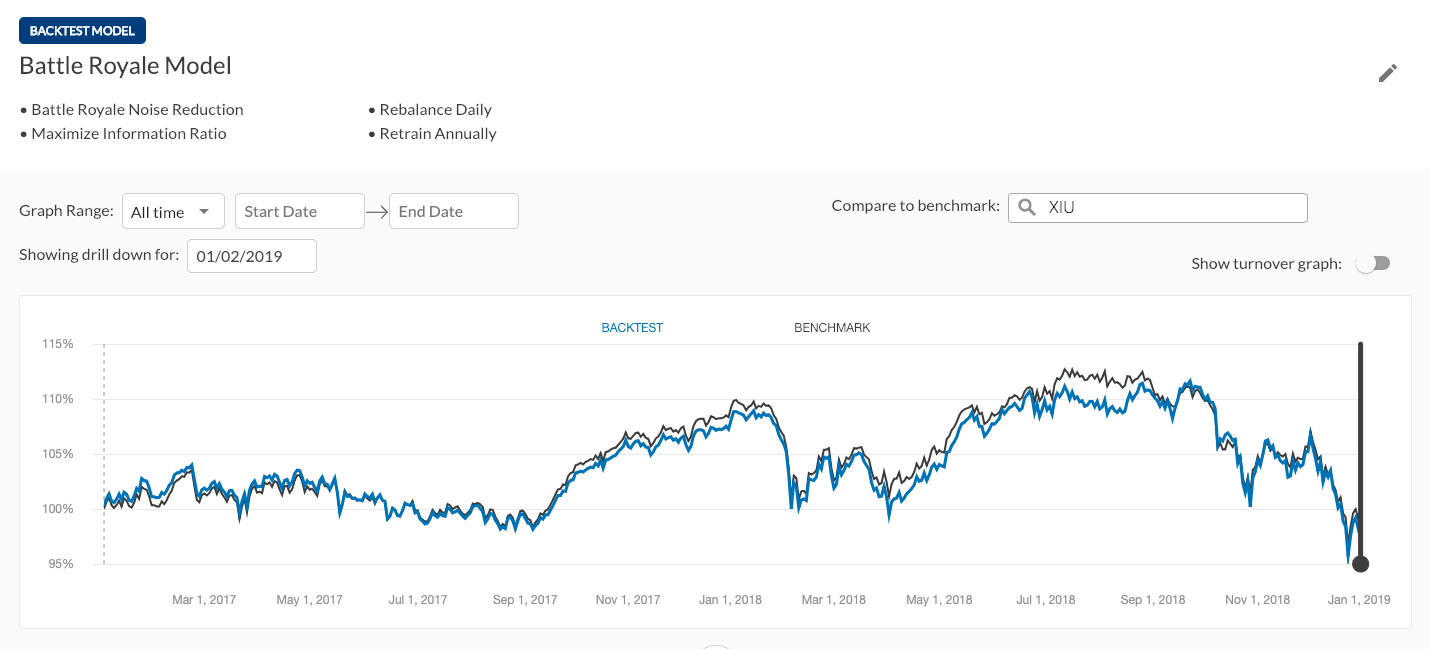
After your model has finished training, you are able to review the results of the backtest in detail over time. Clicking on the graph will set the "drill down" date, which will show Holdings, Trades, Rankings, Allocations and the Stock Universe for that day. The tear sheet and explainability will be based on the entire range of the graph, which can also be adjusted by using the "Graph Range" selection.

ANALYSIS NAVIGATION AND ACTION

- Add Backtest - Add an additional backtest range to the model (See backtest range for more info)
- Go Live - Start live trading with this model (See going live for more info)
- Duplicate to Draft - Create a new untrained model with the same configuration as this model.
This is useful for iterating on backtest results - Archive - Move this model off of your main page and onto the archive list
- Export - Export all model analysis to Excel
- Tear Sheet - View the tear sheet for the model (See tear sheet for more info)
- Explainability - View explainability scores for the model (See explainability for more info)
- Drawdowns - View largest drawdowns throughout all backtest years (See drawdowns for more info)
- Holdings - View holdings drilldown for each day of the backtest (See holdings for more info)
- Allocation - View allocation broken down by Long/Short and by Sector (See allocation for more info)
- Variables - View the selected variables for this model.
Can't be changed without training a new model. (See variable selection for more info) - Trades - View trades drilldown for each day of the backtest (See trades for more info)
- Rankings - View rankings for each day of the backtest (See rankings for more info)
- Stock Universe - View the selected stock universe for this model.
Can't be changed without training a new model. (See stock selection for more info)
