Variable Selection is how you choose what data will be driving trading decisions, which makes it a required step in creating a model. The absolute minimum is 1 variable, but it is highly recommended to choose many more than that. We recommend 20 - 100 variables as a good range to use. Some machine learning algorithms are better at handling a larger number of variables.
VARIABLE PRESETS
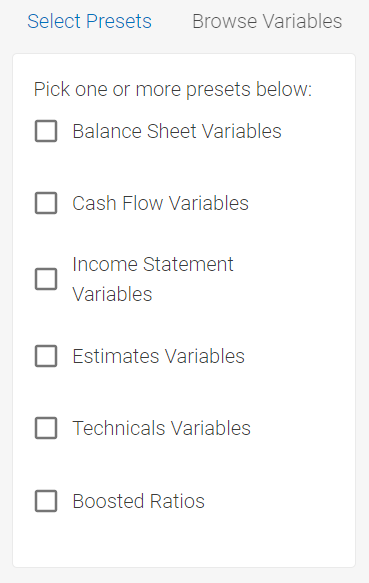
Presets are a way to quickly populate your selection with a collection of variables that we have already thoroughly tested. We generally recommend using the Technicals preset for daily and weekly investment horizon models and the Boosted Ratios for Monthly or longer investment horizons.
BROWSE VARIABLES
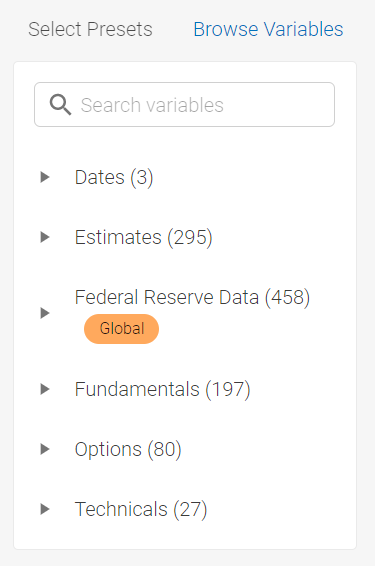
The variable browser allows you to pick individual variables from each of our provided data sets. They can be found by expanding the hierarchy trees in the left section of the screen or by using the search bar.
VARIABLE TRANSFORMATIONS
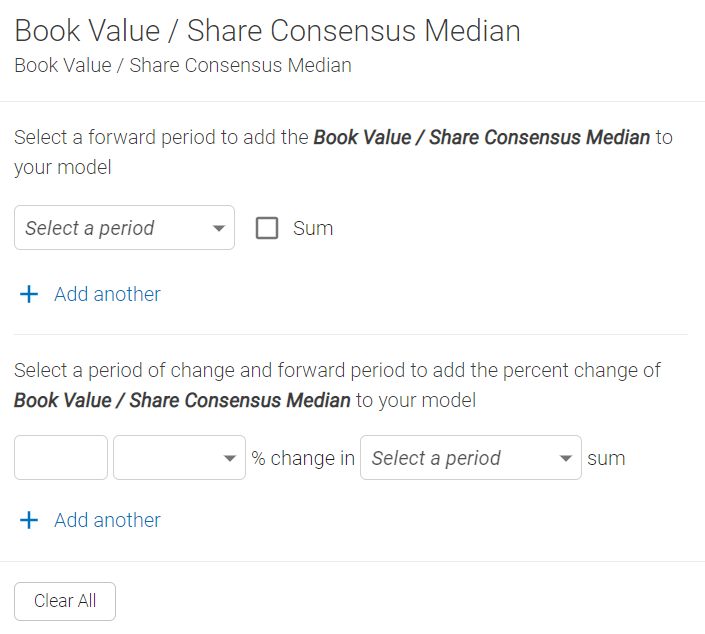
All variables require at least one transformation to be chosen before they will be added to your model. In some cases you may just want the "Actual" value of the point in time data, but in many cases you will care more about the "% change" of a value. When dealing with fundamental or estimates, a relative time transformation is required since the data represents a certain number of quarters previous or ahead respectively.
Because raw data inputs are messy, most variables need to be restructured to become interpretable by the machine or to better fit your needs. You can use raw variables as model inputs, but those variables need to be comparable across companies (i.e. Percent Growth).
Below are the three processes for restructuring variables:
- Formula - Formula is used to combine variables or apply arithmetic to variables to better fit your need. For example, you can subtract Operating Expenses from Gross Profit to create Operating Profit.
- Normalization - Normalization is the process of restructuring variables to be comparable across companies. For example, a variable that looks at the change in stock price should be normalized because a $10 change is a huge movement for a stock that trades at $20 per share but less so for a stock that trades at $2000 per share. To normalize the change in stock price, we would turn it into a % change.
- Transformation - Transformation changes the format of your data for a different view. For example, you can transform Capital Expenditure to 1 Month Change in Capital Expenditure.
 Variable Rollup
Variable Rollup is the grouping of similar features into familiar categories to help us better understand the driving forces behind stock ratings. Every feature is grouped into either Fundamental, Technical, or Macro. Within the 3 categories, there are sub-categories and sub-sub-categories to better organize features. There are Driver Ratings at each level, which help us understand how a feature or category contributes to a stock rating. To learn more, see our article on Drivers and Drive Ratings.
DATASET VALIDATION
When creating a model, one of the important decisions you have to make is what variables to include.
All Variables screen feature dataset coverage data to facilitate this decision. Coverage showcases data fill rates at the beginning of the backtest and at the current date, enabling better understanding of the quality of the dataset for a given stock universe.

